Hyperbuilding 02 — The Heart
A vertical transit hub for 153,000 daily travellers — the circulatory "heart" of a three-tower vertical machine.
- Program team: zoning logic, adjacency matrix & rule-based zone stacking
- Four KPIs written as Python calculators — FRC, PII, NGRER & CFTT
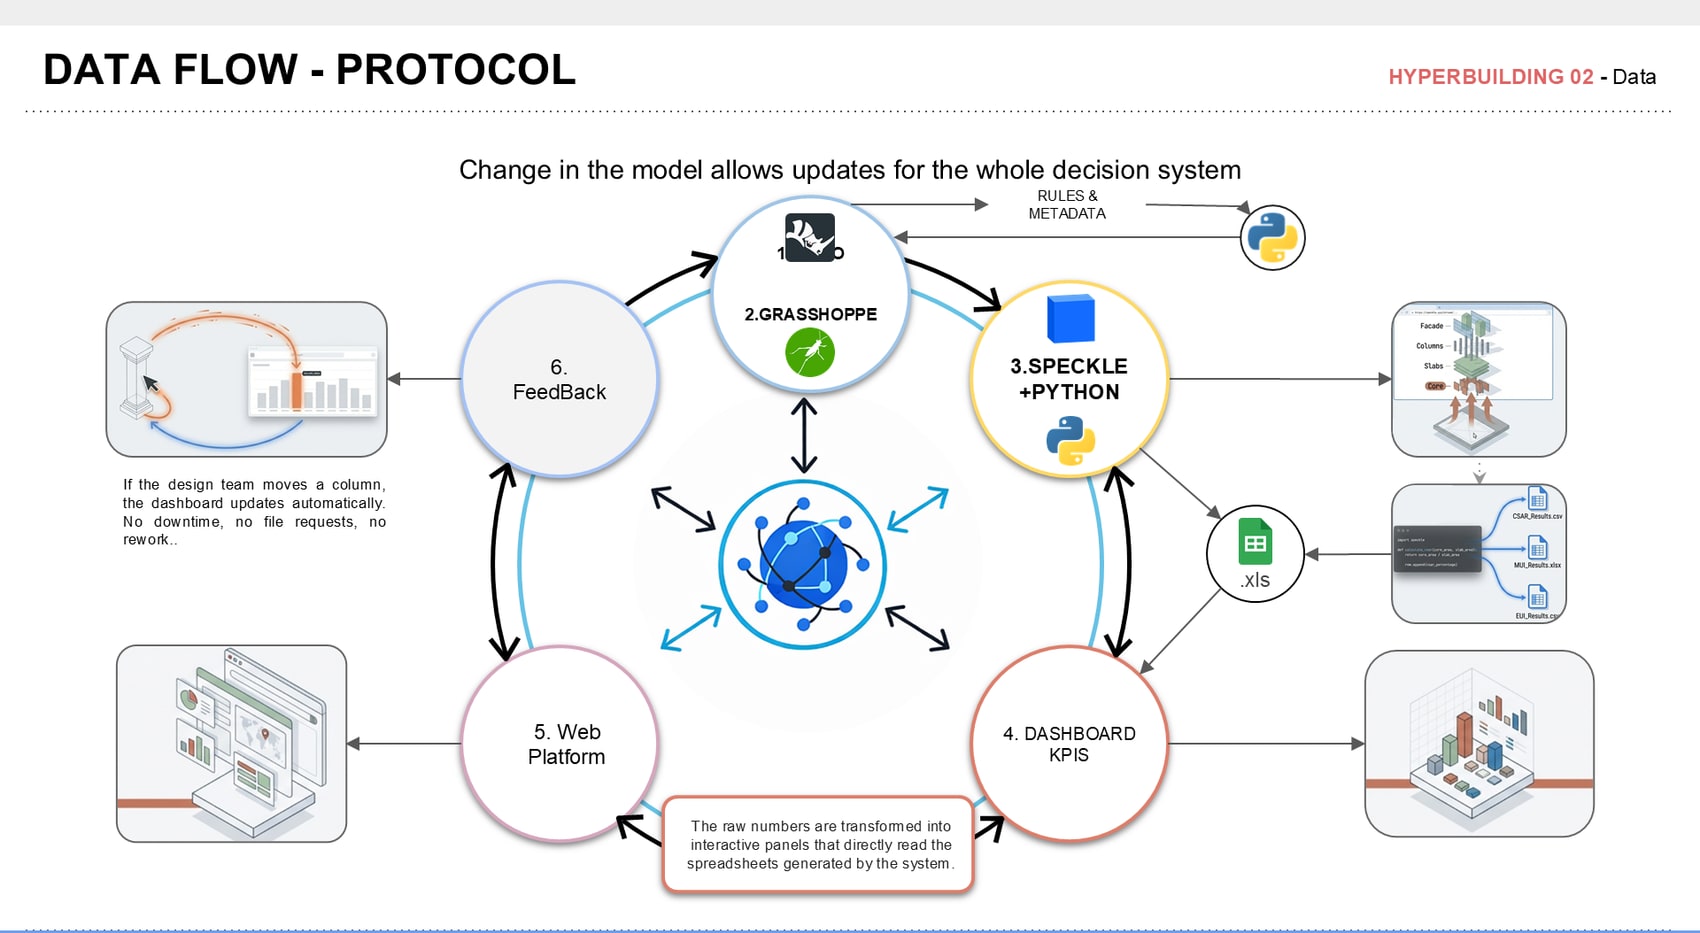
- Live protocol: Rhino → Grasshopper → Speckle + Python → dashboard
The circulatory heart
Hyperbuilding 02 is the heart of the Vertical Machine — a transit hub concentrating 153,000 daily travellers and 20,000 passengers/hour across 8 transit modes. Where HB01 is the lungs and HB03 the cells, HB02 pumps circulation between them: underground networks and elevated bridges distribute people, assets, energy and data as the blood that keeps the organism alive. The brief was a program-integrated hub that reorganises fragmented mobility networks, shortens commutes and anchors a high-density mixed-use core.
The project was delivered by three teams working off one synchronised model. Data established demand and performance criteria; Program — my team, with Nihan Malkoc and Marina Osmolovska — translated that data into spatial and zoning logic; Structure & Facade turned the zoning into an integrated structural system. My work below is the Program chapter, shown slide by slide.
Massing from circulation
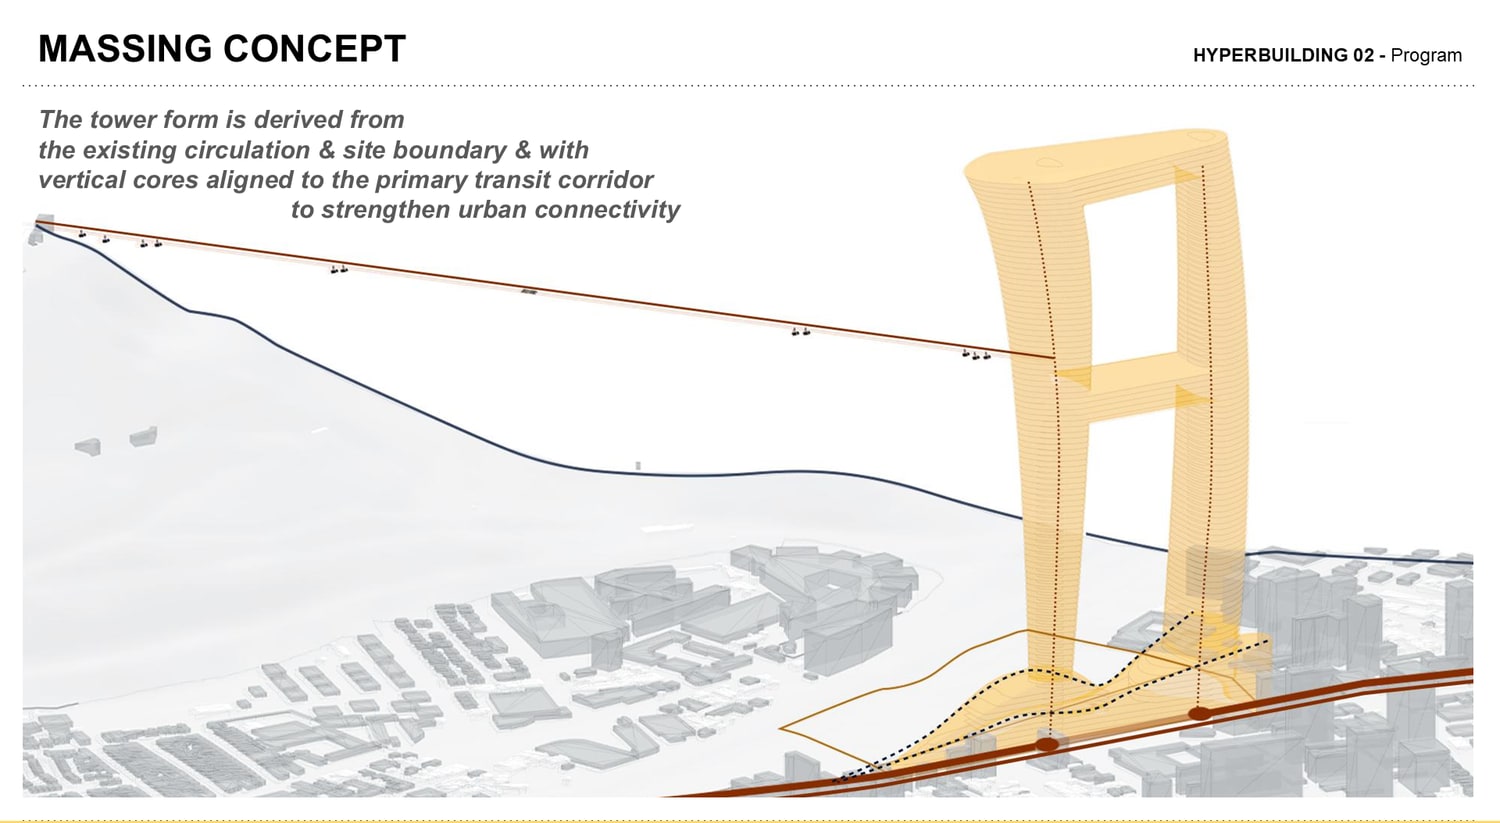
The tower form is derived from the existing circulation and site boundary, with vertical cores aligned to the primary transit corridor to strengthen urban connectivity — two legs bridged into a single frame, set against the Andes and the metro line running through the site.
The program workflow
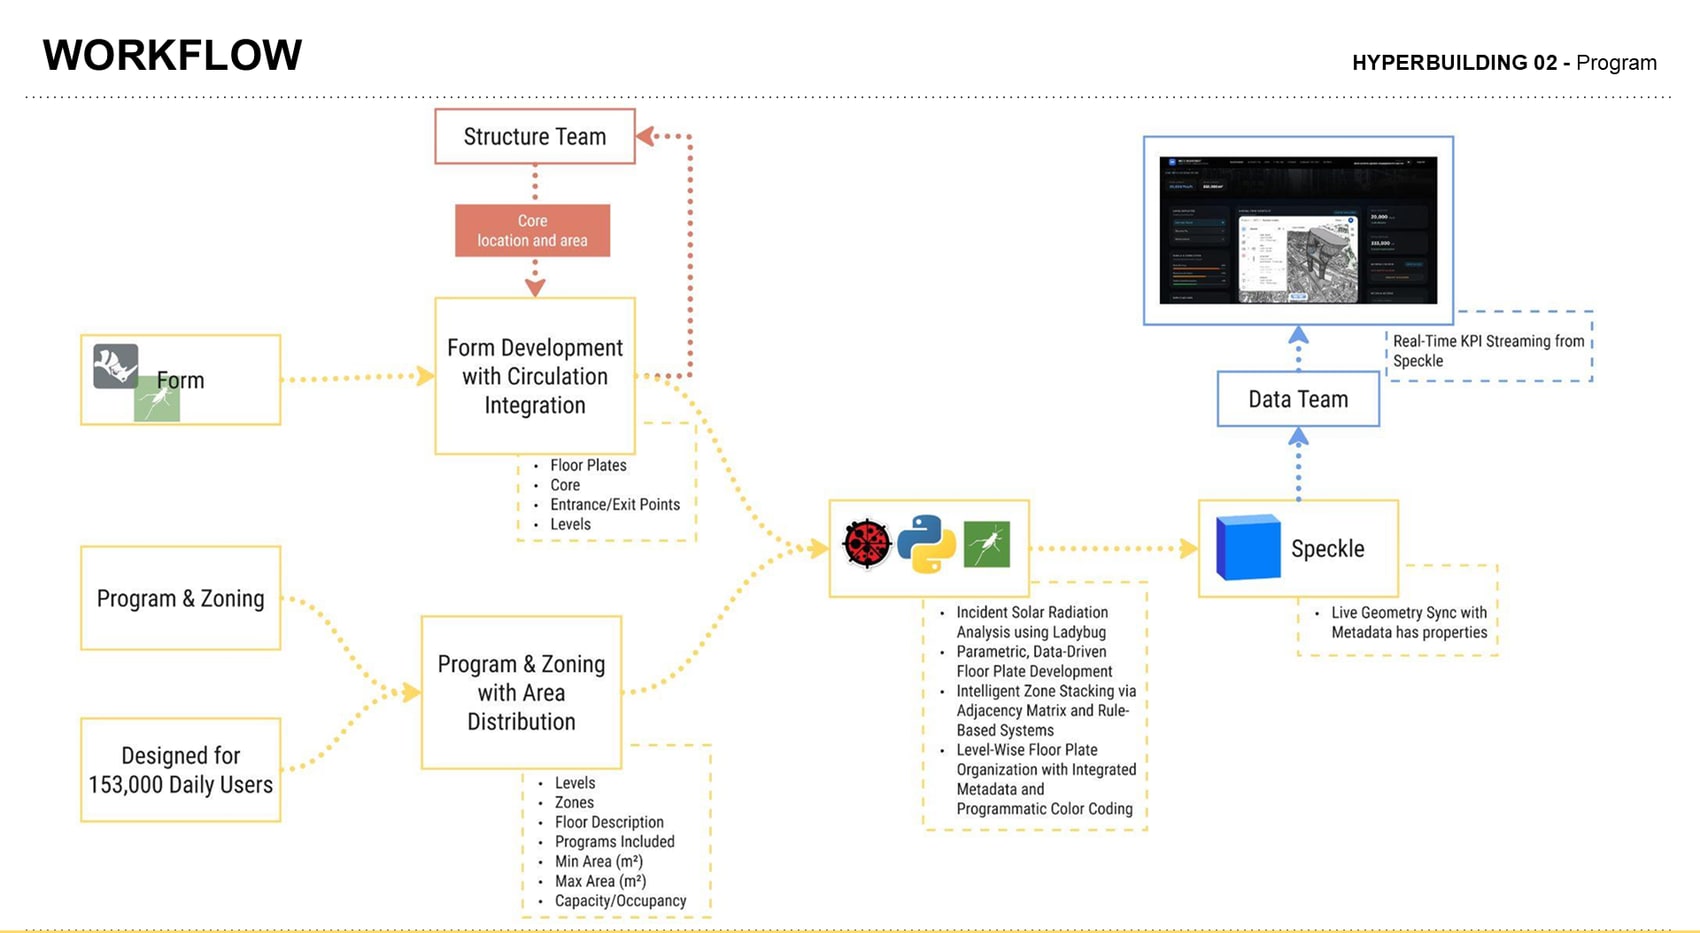
Two inputs drive everything: form (floor plates, core, entrance/exit points, levels) and program & zoning with area distribution (levels, zones, floor description, programs included, min/max area, capacity/occupancy) — all sized for 153,000 daily users. The Structure team feeds back core location and area; we return floor plates and zoning. Everything is processed in Rhino, Grasshopper and Python — incident solar radiation via Ladybug, parametric floor-plate development, intelligent zone stacking through an adjacency matrix and rule-based system, and level-wise floor-plate organisation with integrated metadata and programmatic colour coding — then pushed to Speckle as live geometry with embedded properties, where the Data team streams it into the KPI dashboard.
Adjacency & program mix
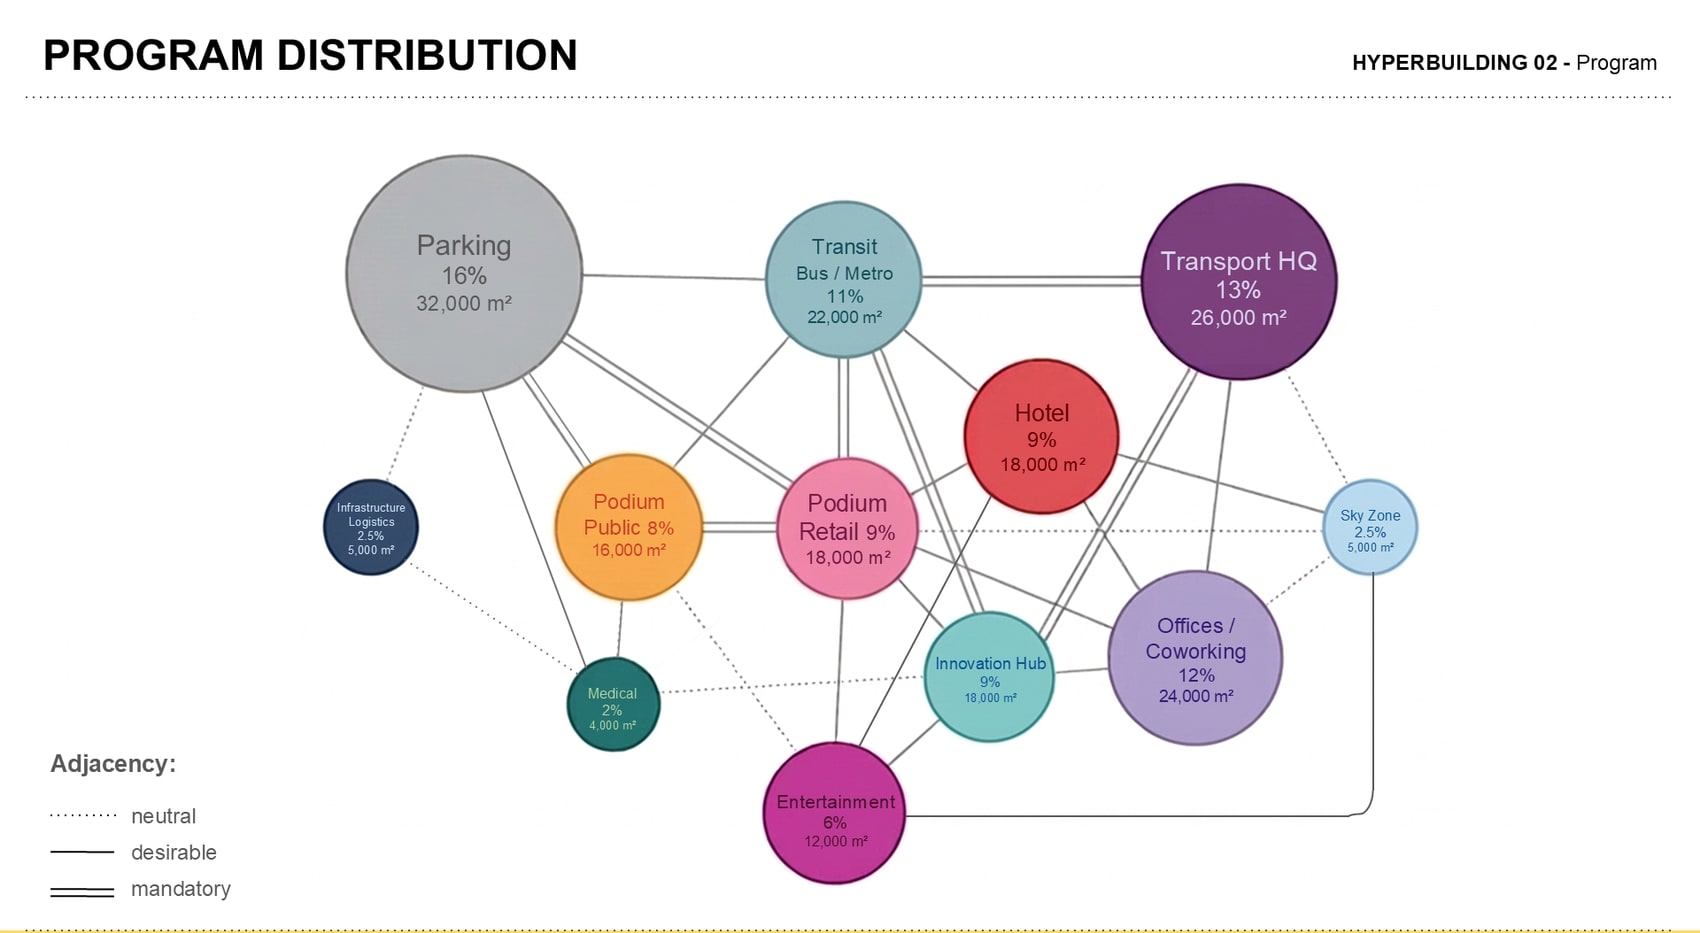
Eleven program zones are balanced across roughly 200,000 m², from Parking at 16% (32,000 m²) down to Medical at 2% (4,000 m²). In the graph below, node size reads program area and every pairing is graded mandatory (double line), desirable (single) or neutral (dotted) — so Parking, Transit and Transport HQ bind tightly at the top while Medical and Infrastructure sit loose at the edge. That matrix is exactly what the stacking rules consume.
The site
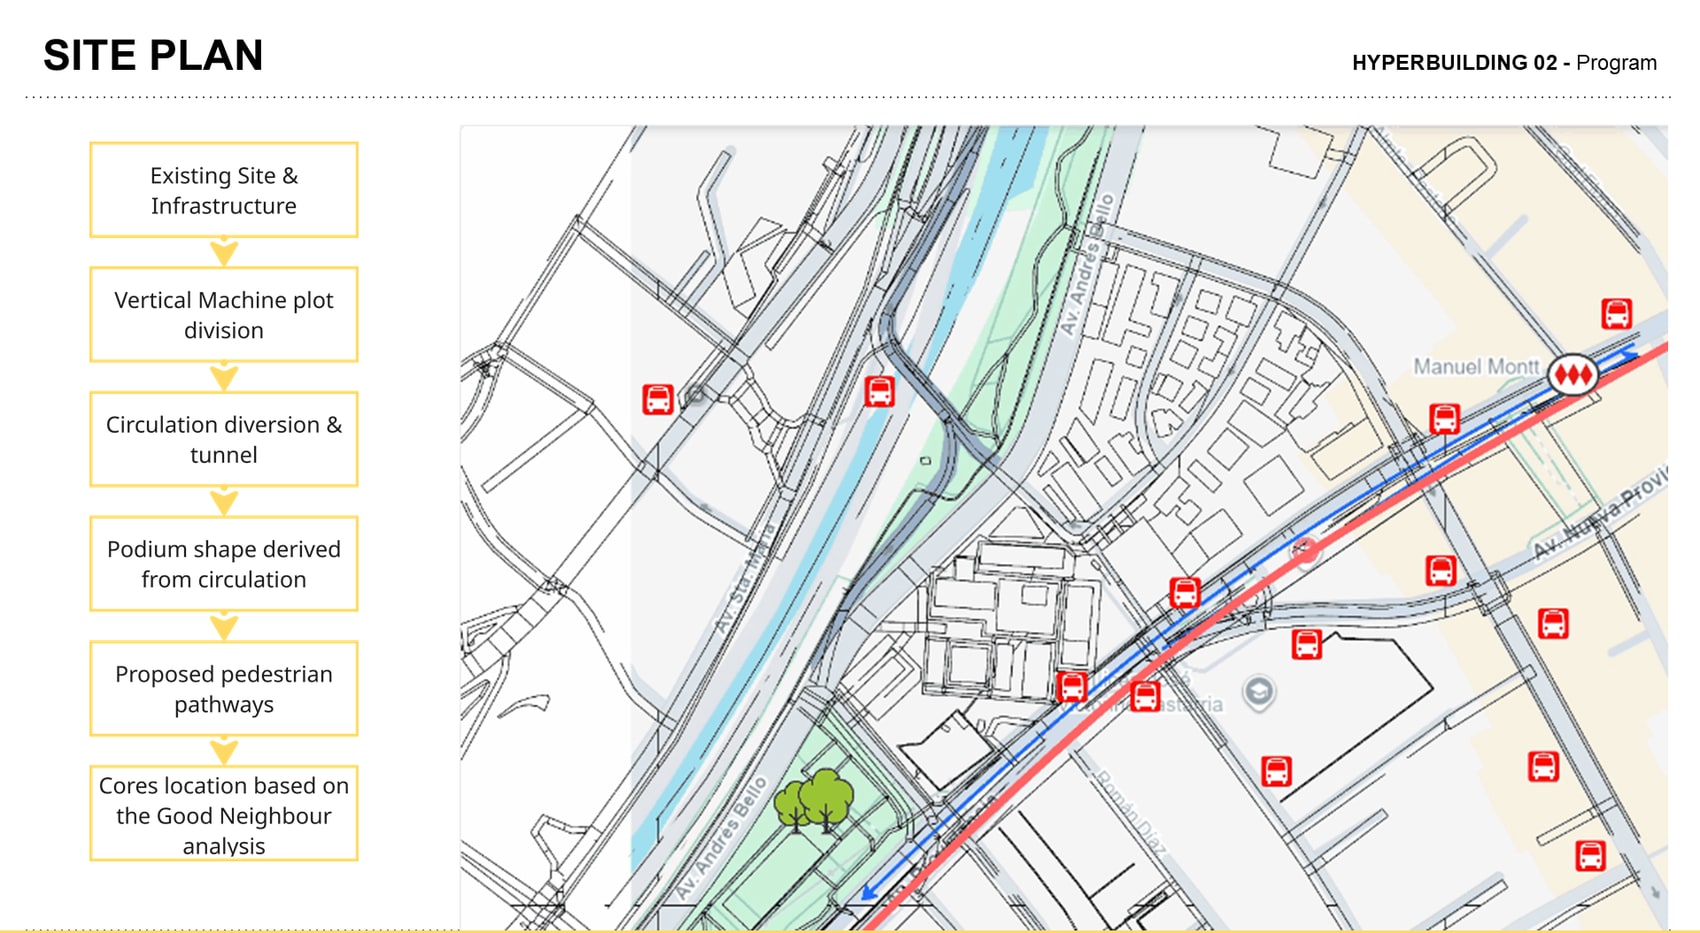
The hub sits on Avenida Andrés Bello beside the Mapocho river in Santiago, at the Manuel Montt metro interchange with bus stops threading the surrounding blocks. The massing is derived in six fixed steps: existing site and infrastructure → Vertical Machine plot division → circulation diversion and tunnel → podium shape derived from circulation → proposed pedestrian pathways → core locations set by the Good Neighbour analysis.
KPIs we built
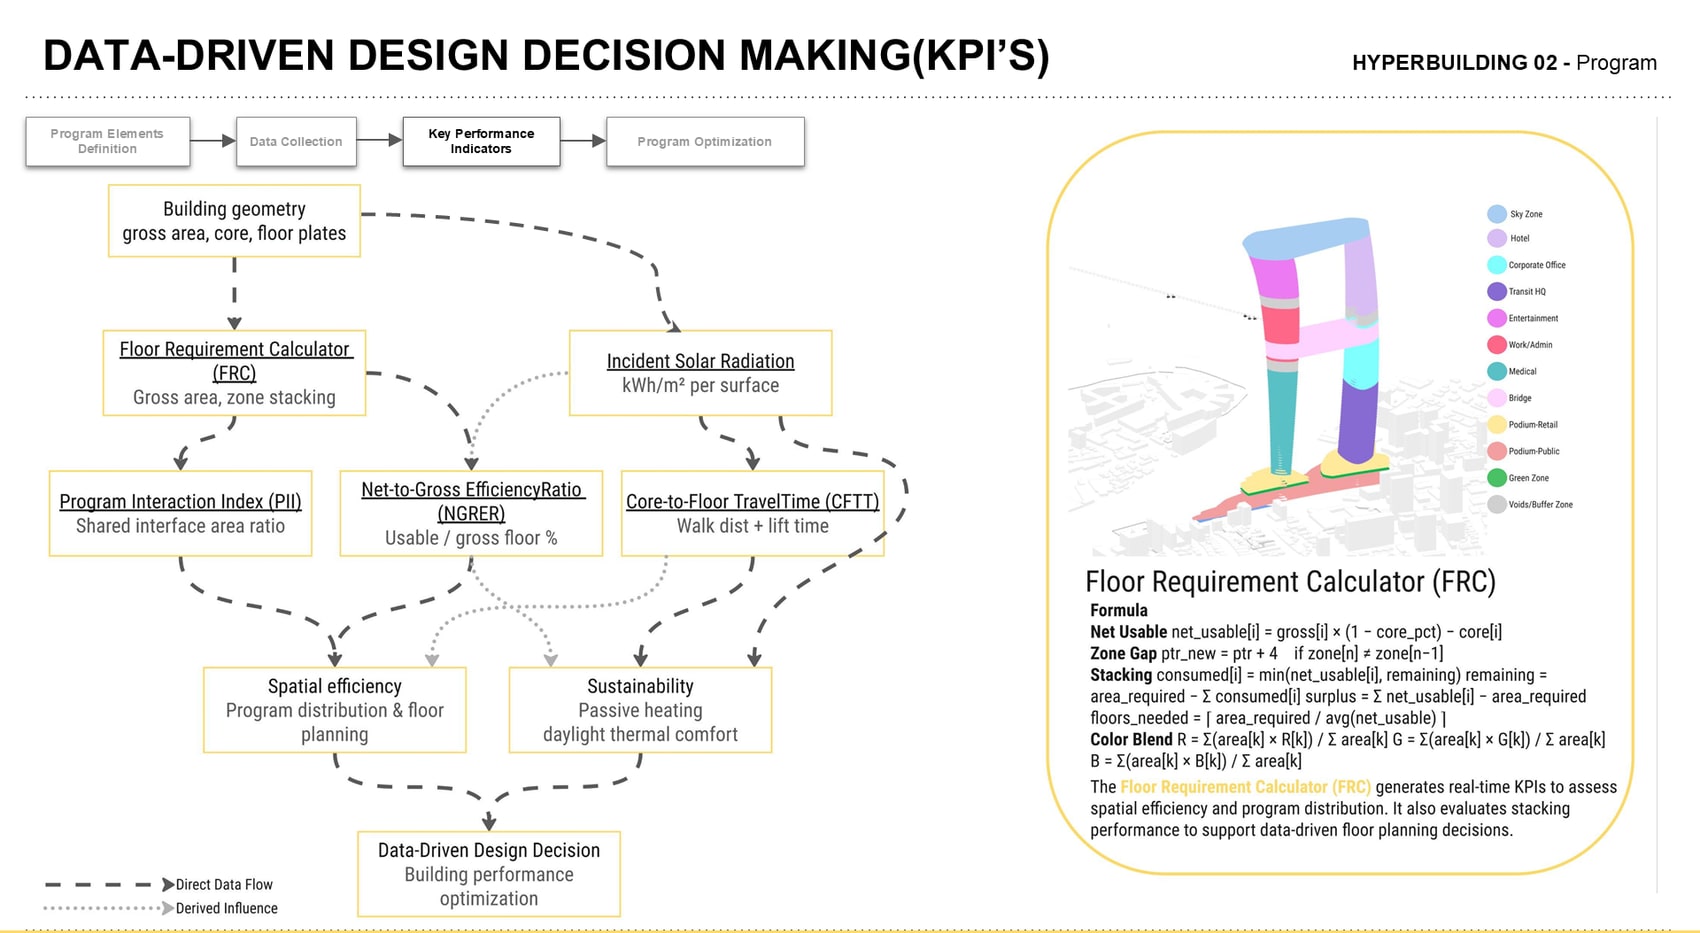
Rather than judging the stack by eye, we wrote our own measures and coded each as a Python calculator inside the Grasshopper definition — the third stage of a four-step loop that runs program elements definition → data collection → key performance indicators → program optimisation. Building geometry (gross area, core, floor plates) feeds the Floor Requirement Calculator (FRC), which resolves zone stacking; FRC and an Incident Solar Radiation analysis then feed three indices — PII, NGRER and CFTT. Together they resolve into the two questions the design has to answer: spatial efficiency (program distribution and floor planning) and sustainability (passive heating, daylight, thermal comfort).
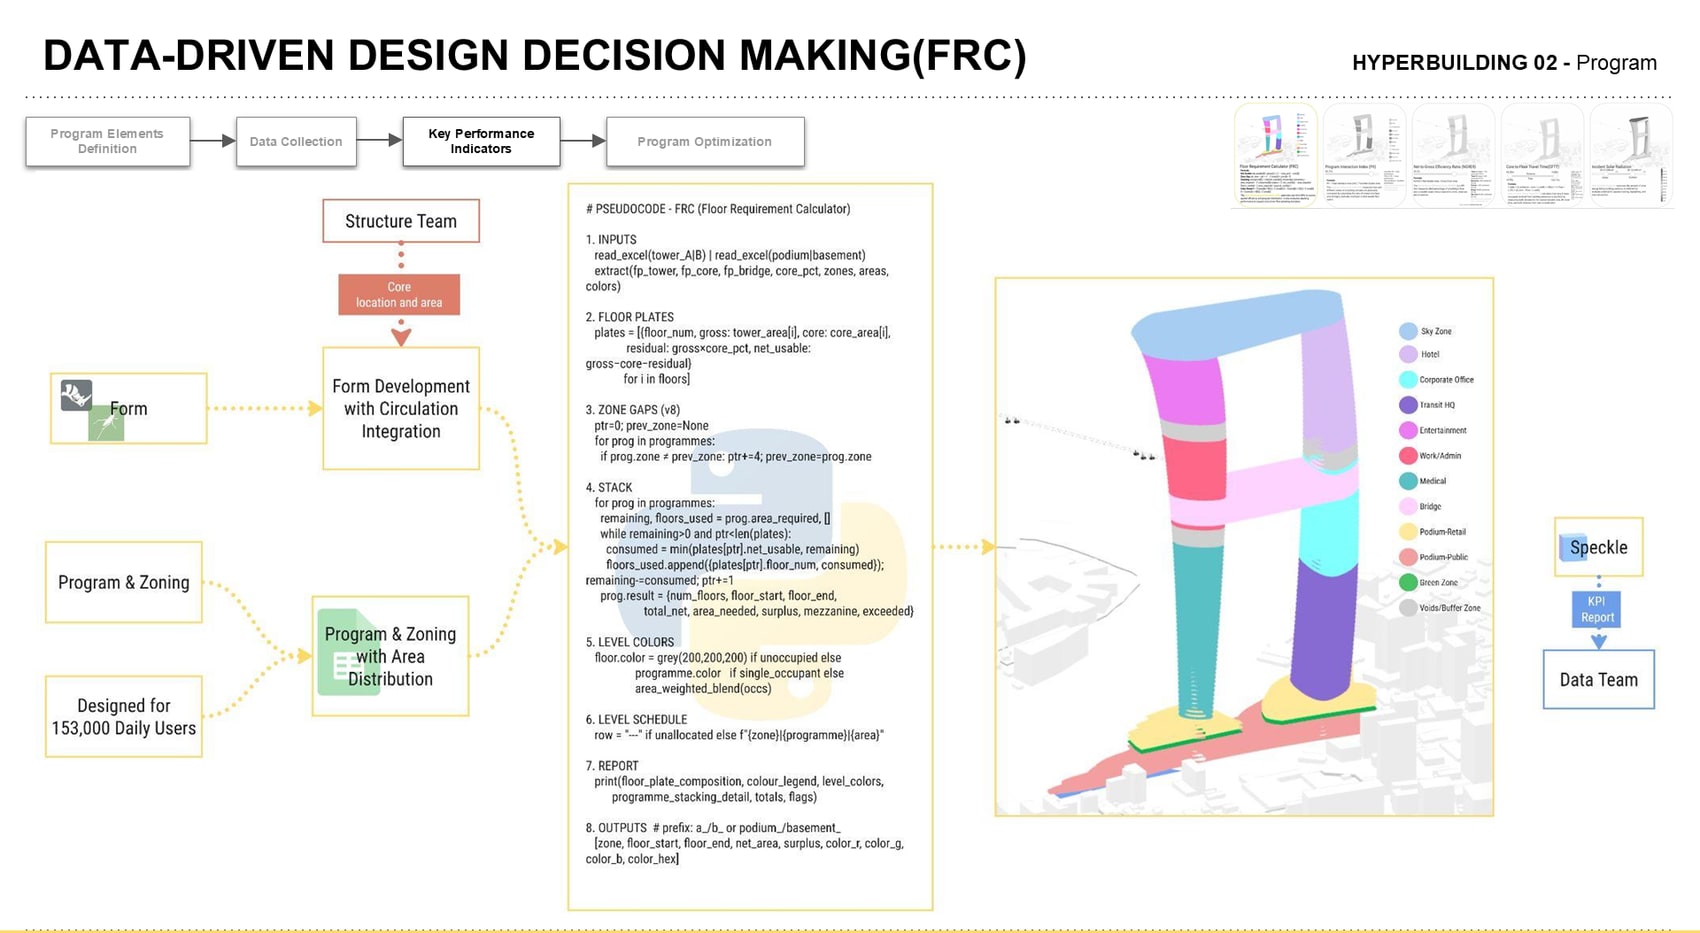
The Floor Requirement Calculator is the engine the other three build on. It computes net usable area per floor as net_usable = gross × (1 − core_pct) − core, inserts a four-floor zone gap wherever the program changes, then stacks each program by consuming min(net_usable, remaining) floor by floor until its area requirement is met — reporting floors used, surplus, mezzanine and any exceeded flags. Floors with a single occupant take that program's colour; mixed floors take an area-weighted colour blend, so the stacking diagram is itself a readout of the calculation.
ISR & PII — radiation & interaction
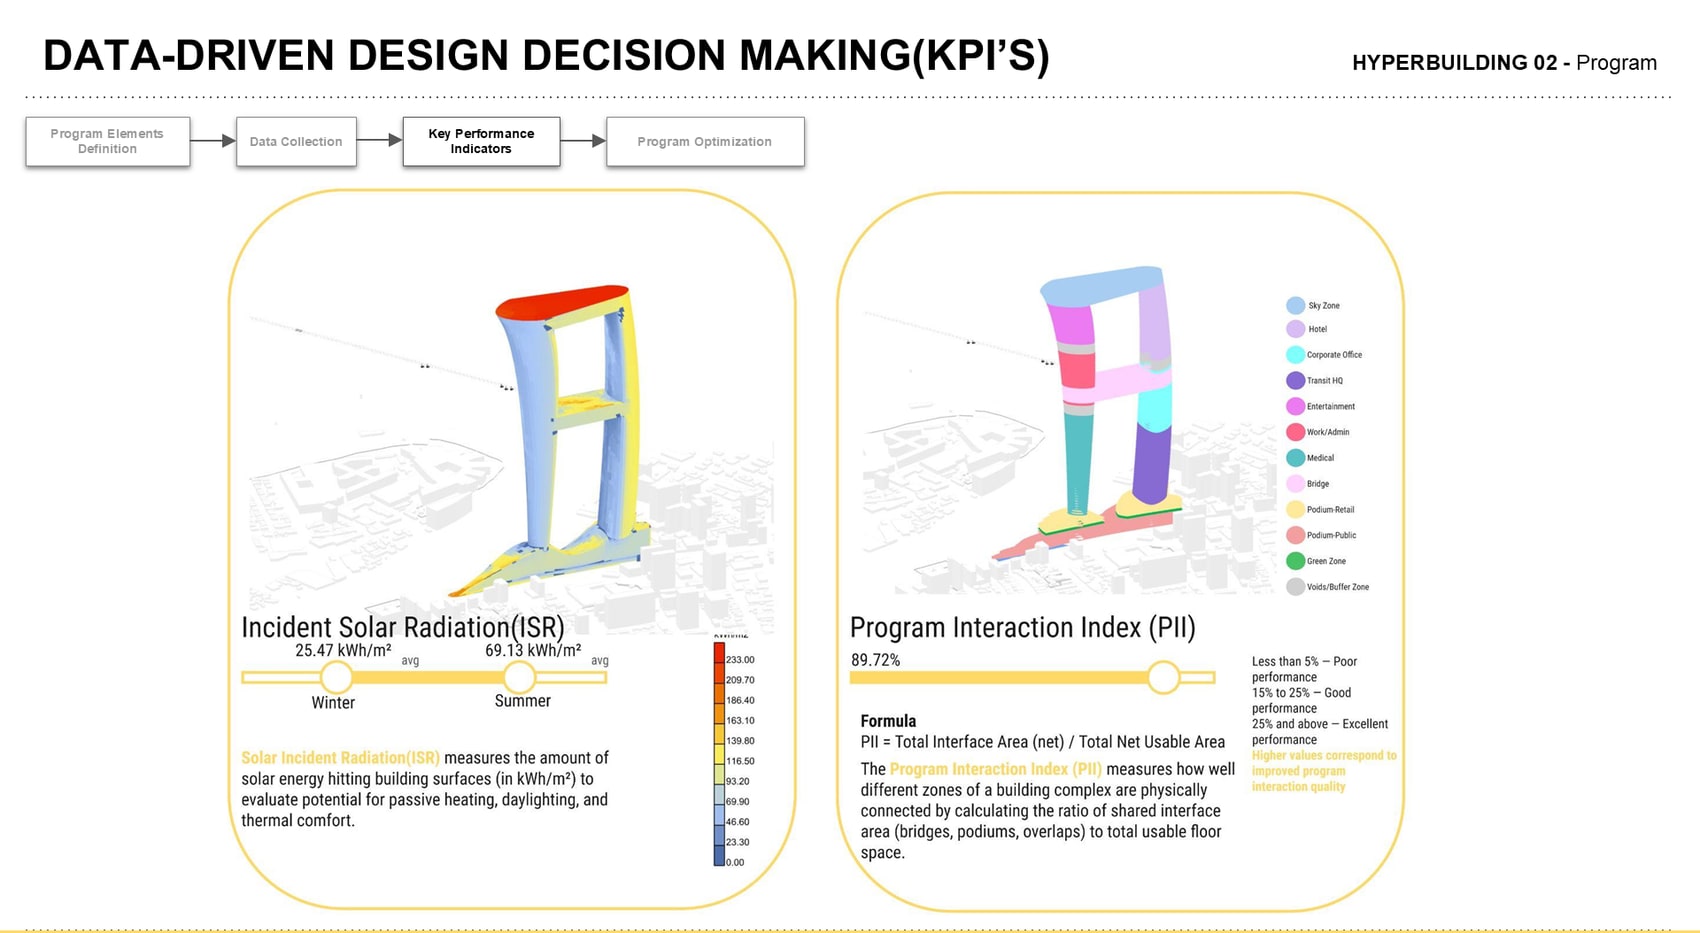
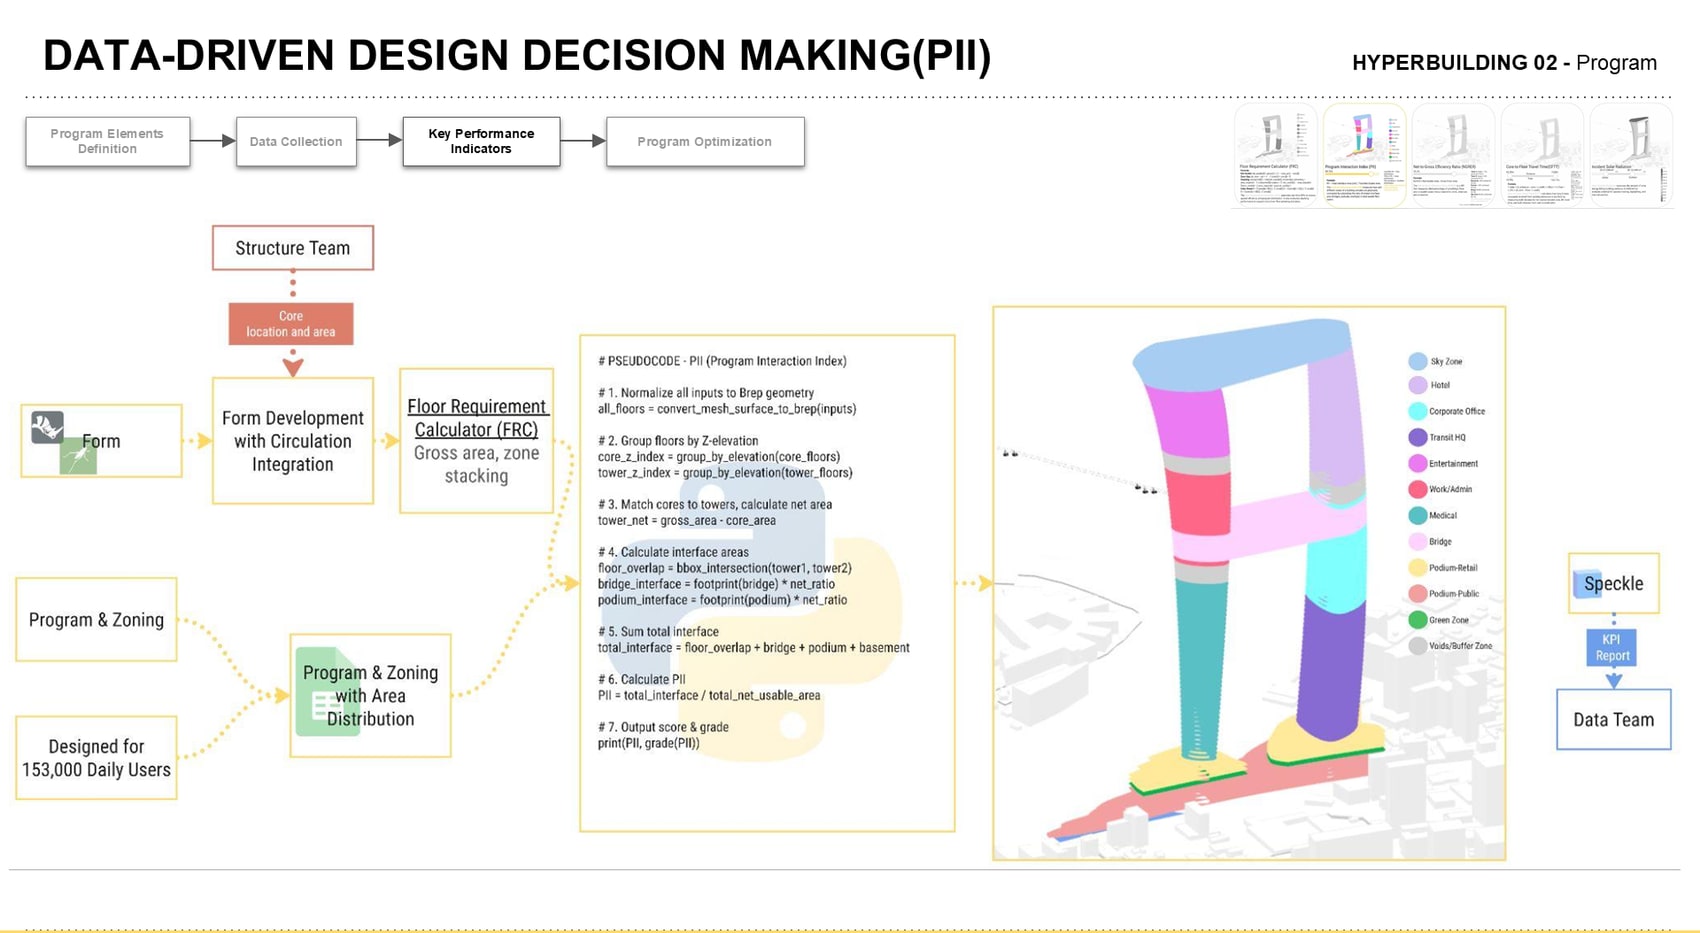
Incident Solar Radiation measures energy hitting building surfaces to evaluate passive heating, daylighting and thermal comfort — 25.47 kWh/m² in winter against 69.13 kWh/m² in summer on average. The Program Interaction Index asks how well the complex's zones are physically connected: PII = total interface area (net) / total net usable area, counting bridges, podiums and floor overlaps. Above 25% is excellent performance — HB02 scores 89.72%, a direct consequence of the bridge, the shared podium and the twin-tower overlap.
NGRER & CFTT — efficiency & travel time
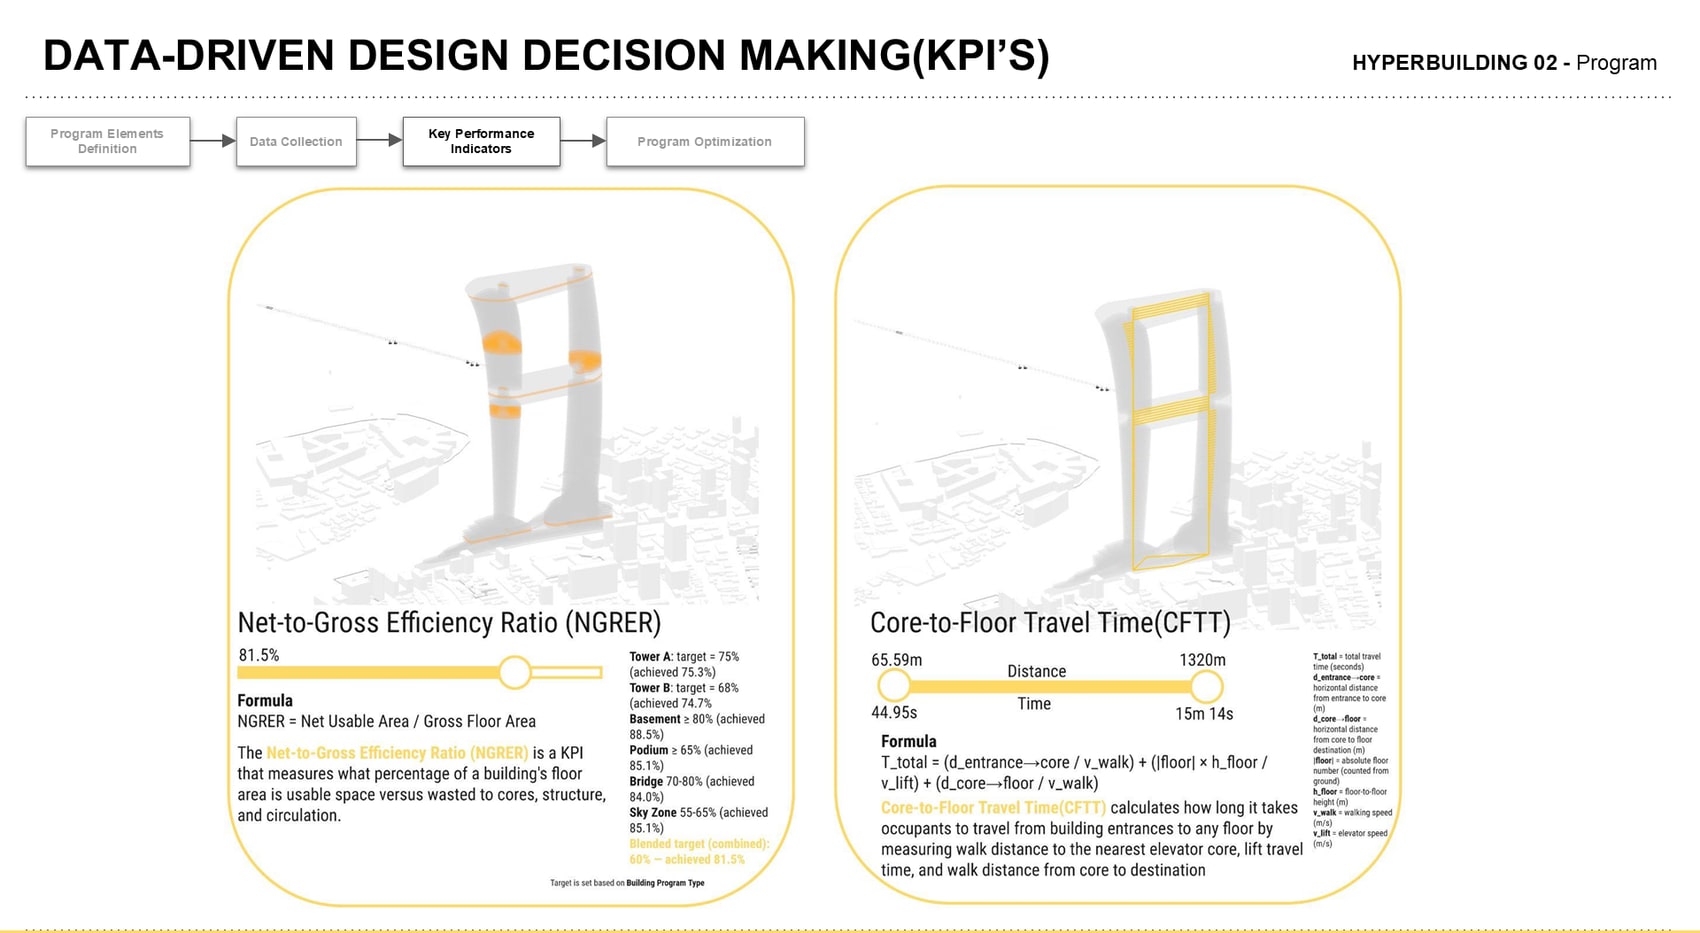
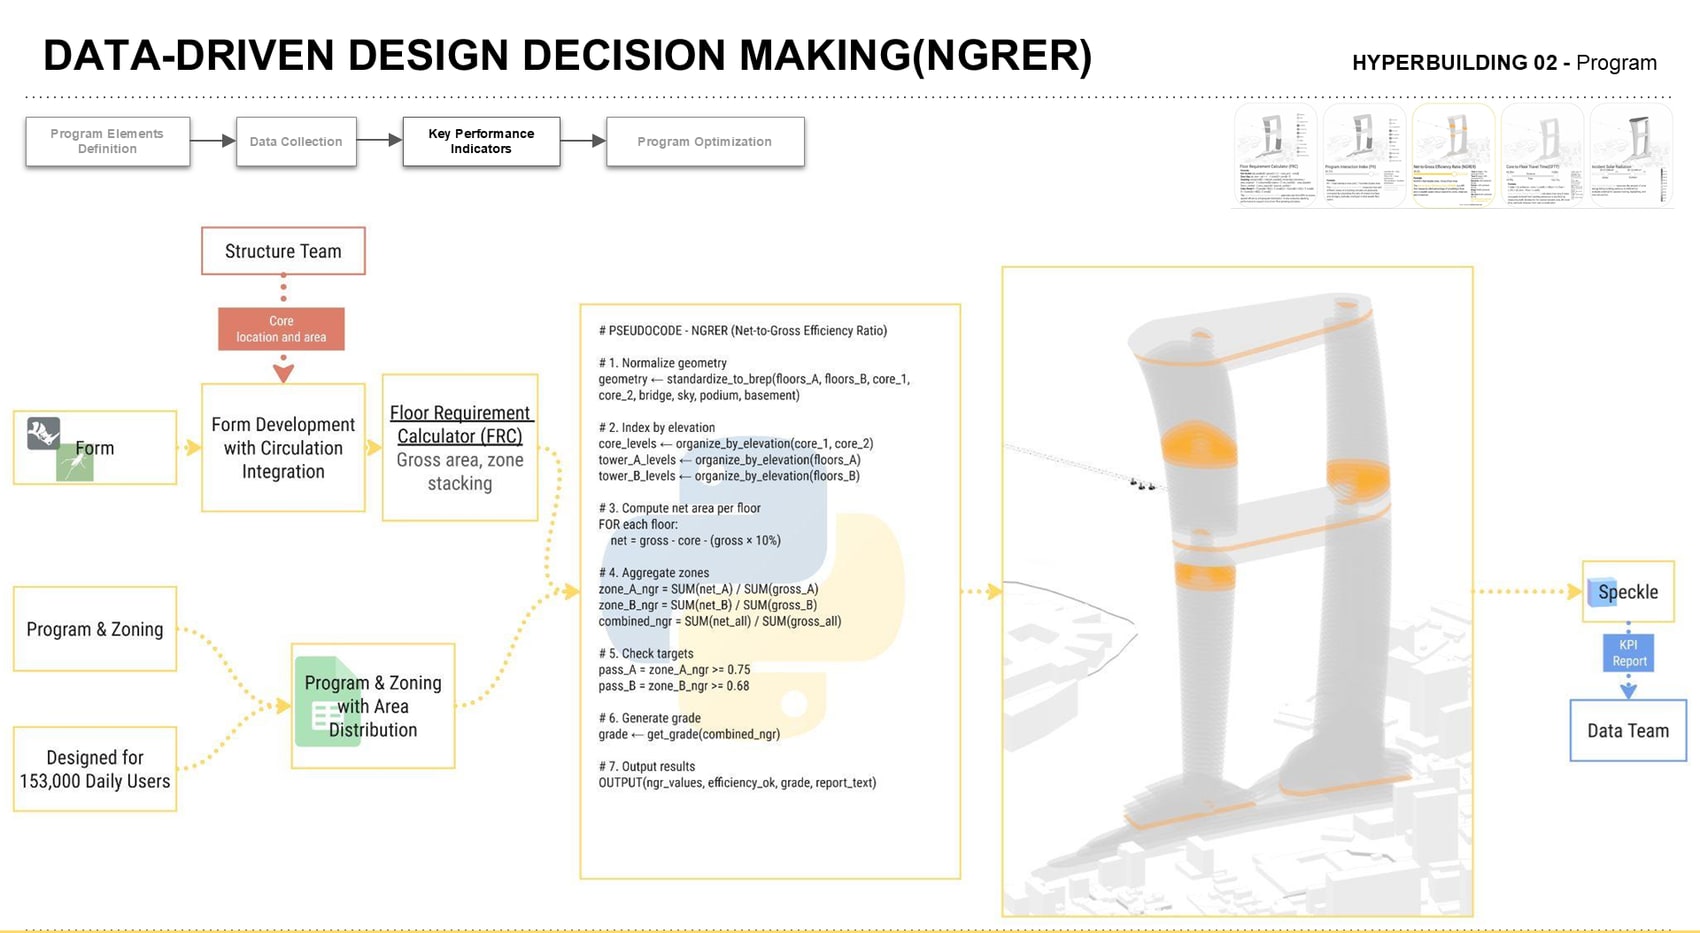
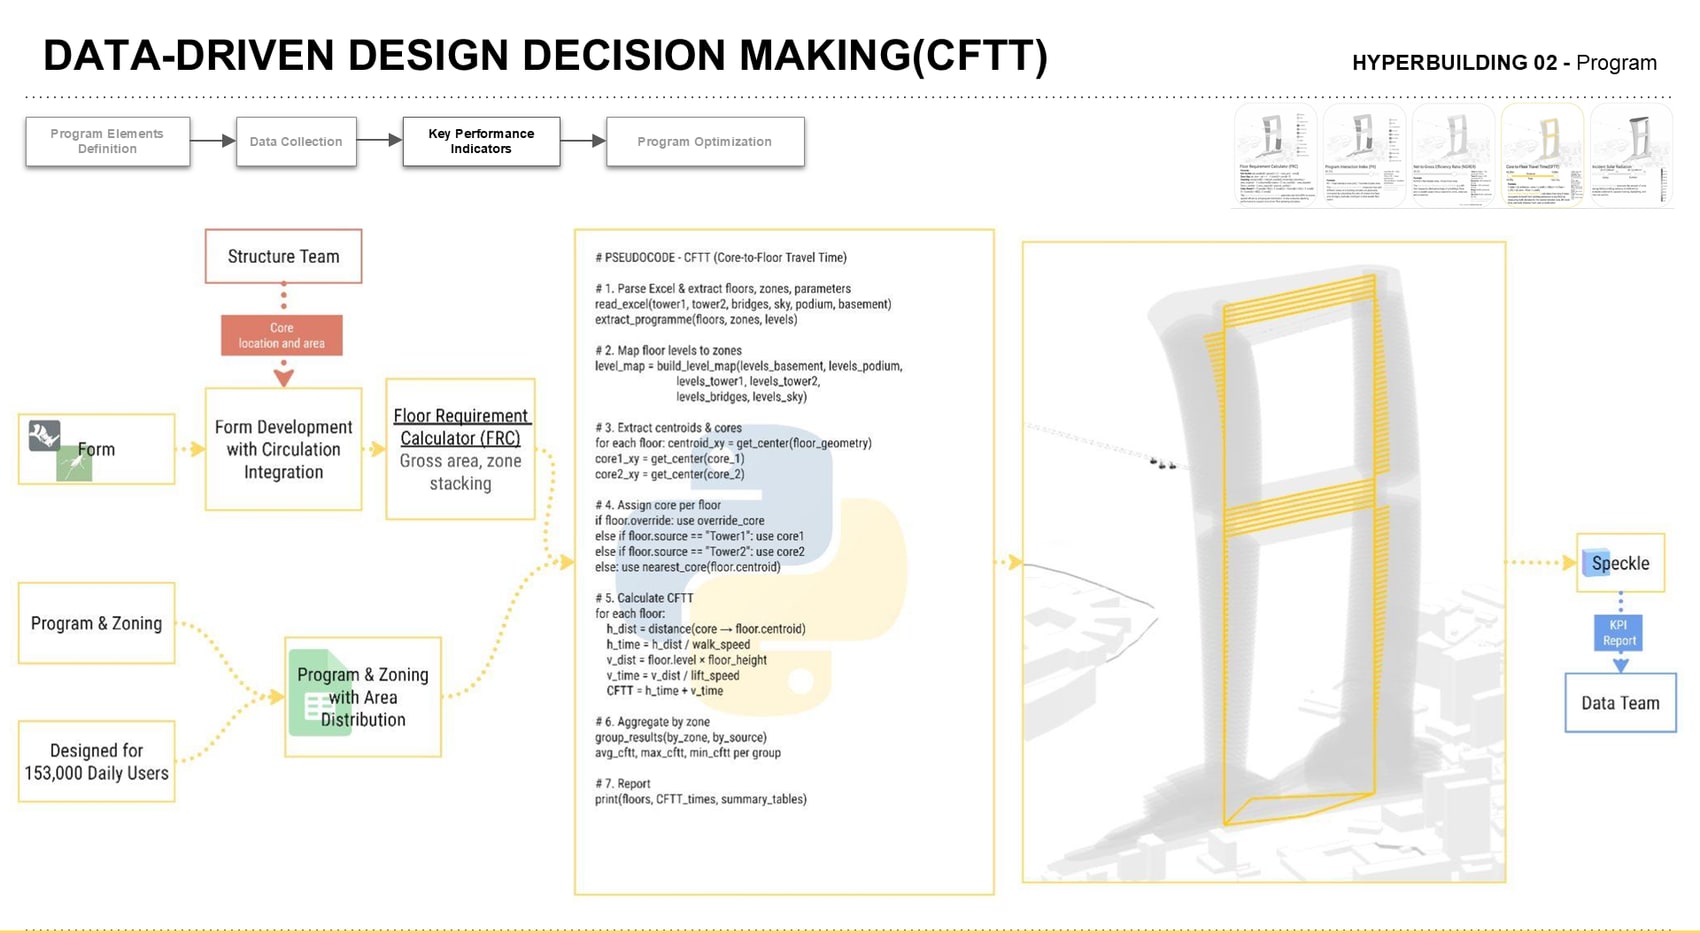
Net-to-Gross Efficiency Ratio measures how much floor area is usable rather than lost to cores, structure and circulation. Targets are set per program type — Tower A 75% (achieved 75.3%), Tower B 68% (74.7%), basement ≥80% (88.5%), podium ≥65% (85.1%), bridge 70–80% (84.0%), sky zone 55–65% (85.1%) — against a blended target of 60%, with 81.5% achieved. Core-to-Floor Travel Time then tests whether that efficiency is actually reachable: T_total = (d_entrance→core / v_walk) + (|floor| × h_floor / v_lift) + (d_core→floor / v_walk), giving 44.95 s at the nearest floor and 15 min 14 s at the furthest, across 65.59 m to 1,320 m of travel.
Written as Python
Each KPI is a documented calculator, not a spreadsheet — every one reading the same model and writing its result back through Speckle to the Data team's KPI report. FRC reads the tower/podium/basement Excel inputs, builds floor plates, applies zone gaps and stacking, then outputs a level schedule with colours. PII normalises inputs to Brep geometry, groups floors by Z-elevation, matches cores to towers and sums bridge, podium and overlap interfaces. NGRER indexes by elevation, computes net per floor as gross − core − (gross × 10%), aggregates by zone and checks each against its target. CFTT maps levels to zones, extracts floor centroids, assigns the nearest core per floor and aggregates walk-plus-lift time by zone.
Podium & basement
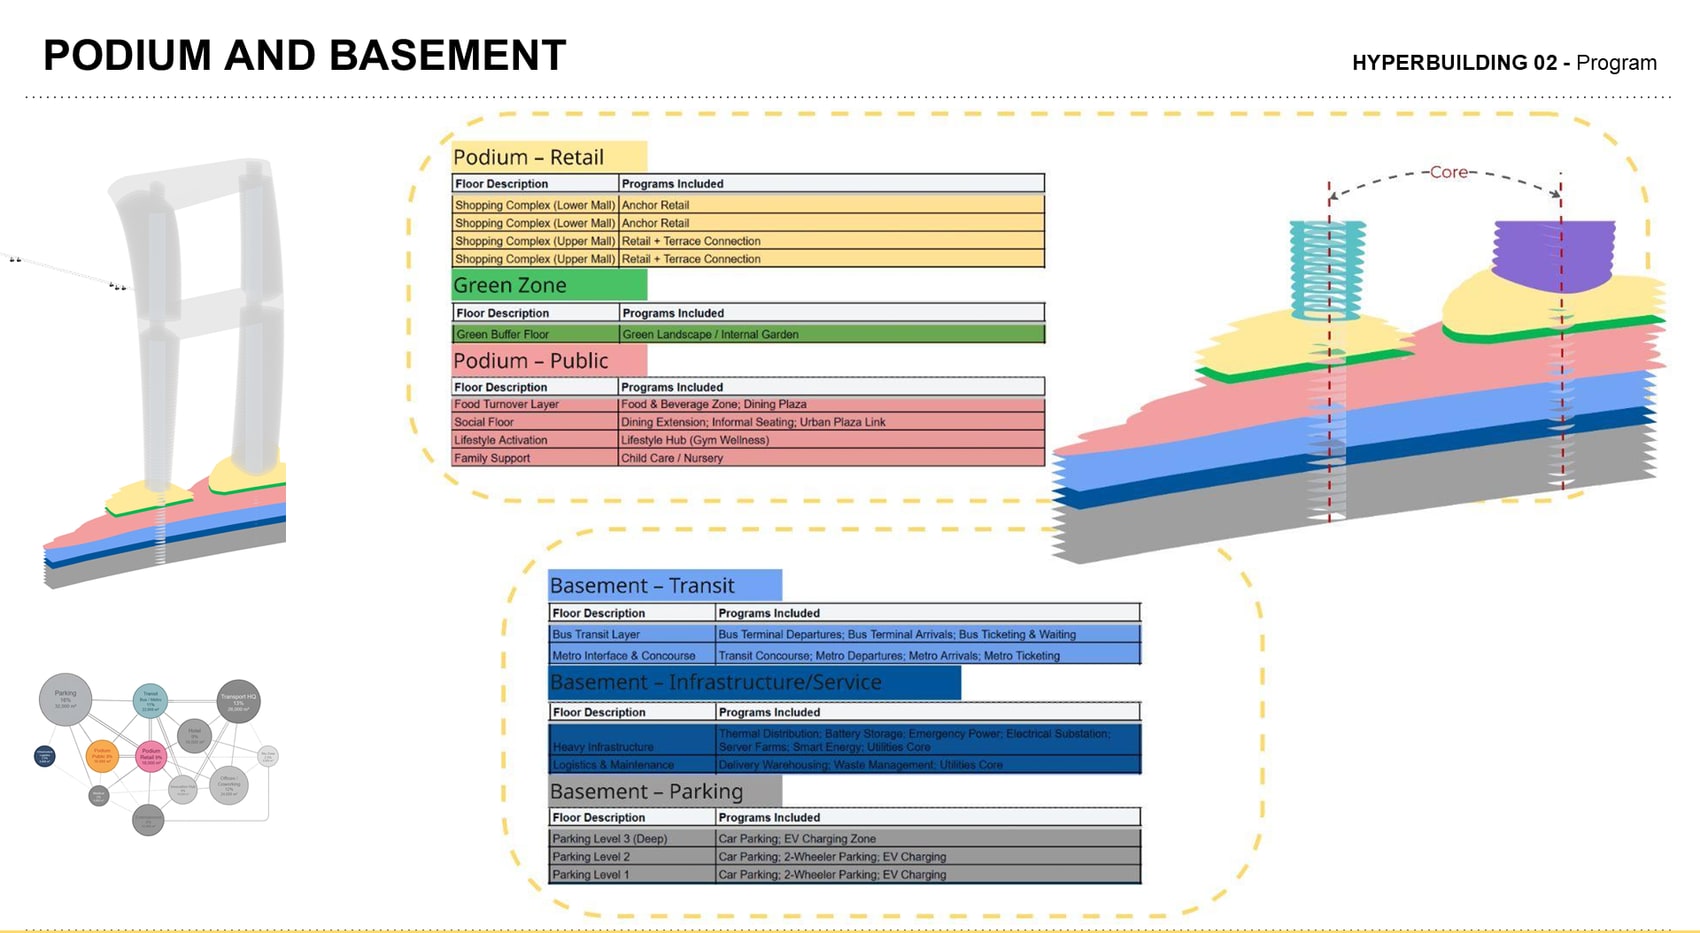
Below and around the ground plane the hub does its public work. The podium retail runs anchor retail across a lower mall and retail-plus-terrace connections above; a green buffer floor separates it from the podium public layers — food and beverage, dining plaza, social floor, lifestyle hub and child care. The basement holds the transit itself: bus terminal departures, arrivals and ticketing, then the metro interface and concourse, with heavy infrastructure (thermal distribution, battery storage, emergency power, substation, server farms), logistics, and three parking levels with EV charging.
Towers & sky
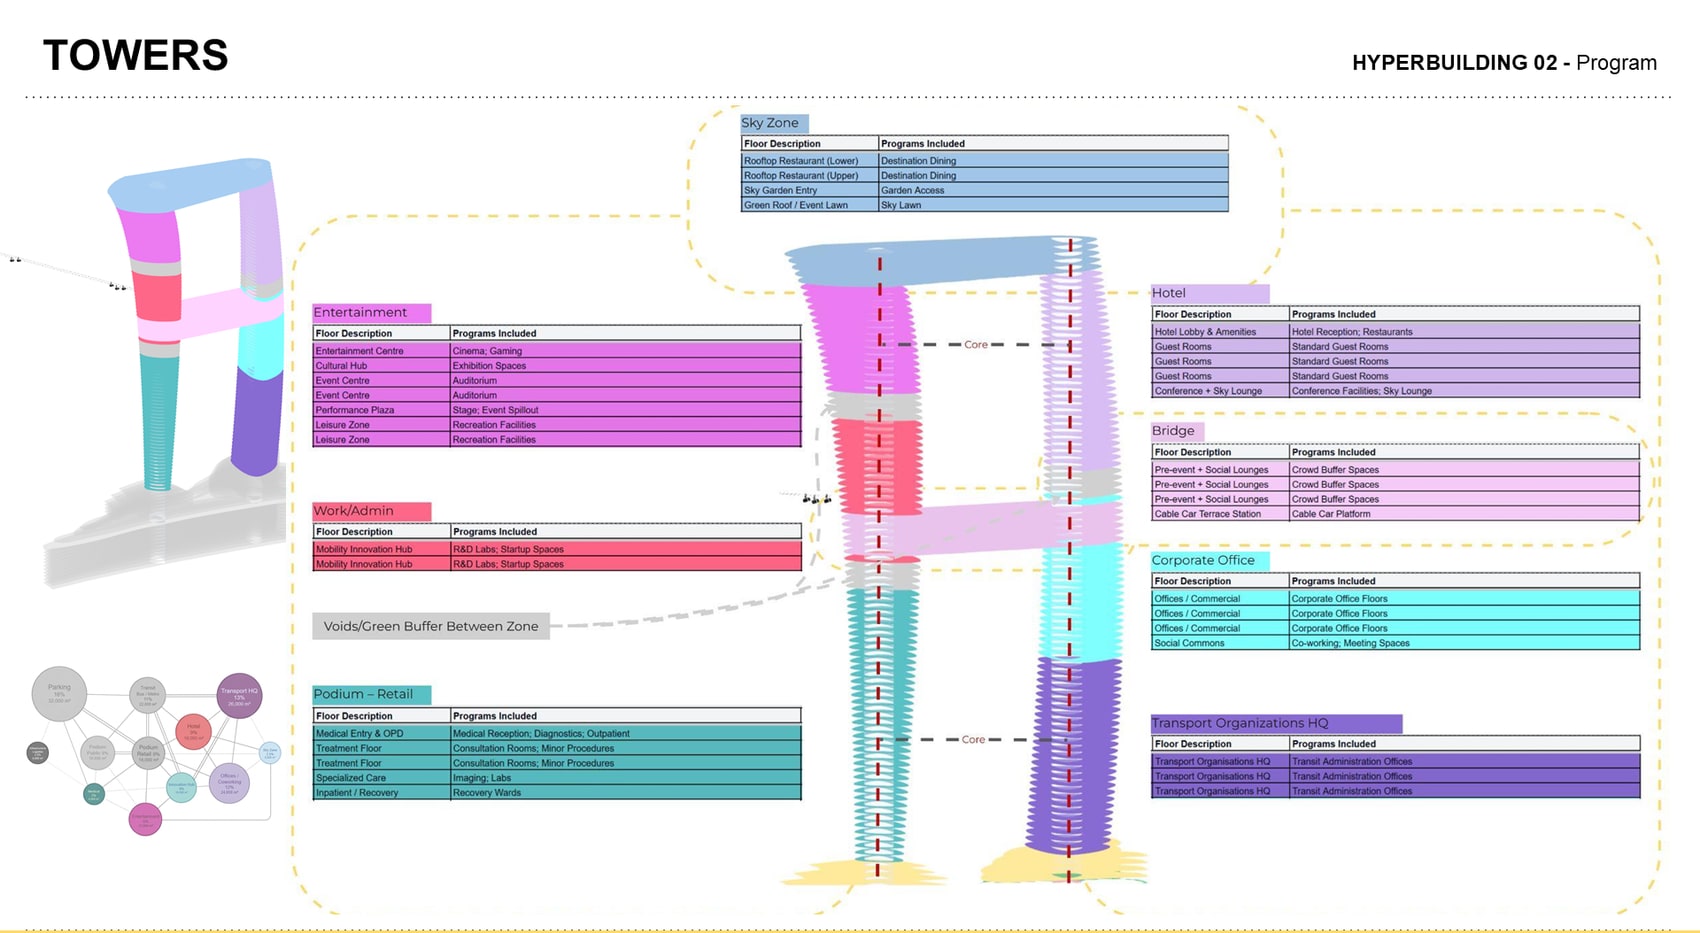
The towers stack the resolved program: Transport Organisations HQ and corporate office rise from the podium in one tower, medical — reception, OPD, treatment floors, imaging and recovery wards — and the Mobility Innovation Hub of R&D labs and startup spaces in the other. The bridge carries pre-event and social lounges as crowd buffer space plus a cable-car terrace station; above it sit entertainment (cinema, exhibition, auditoria, leisure), the hotel, and the Sky Zone of rooftop restaurants, sky garden and event lawn. Voids and green buffers hold the zones apart — the four-floor gaps the FRC inserts.
Good neighbour
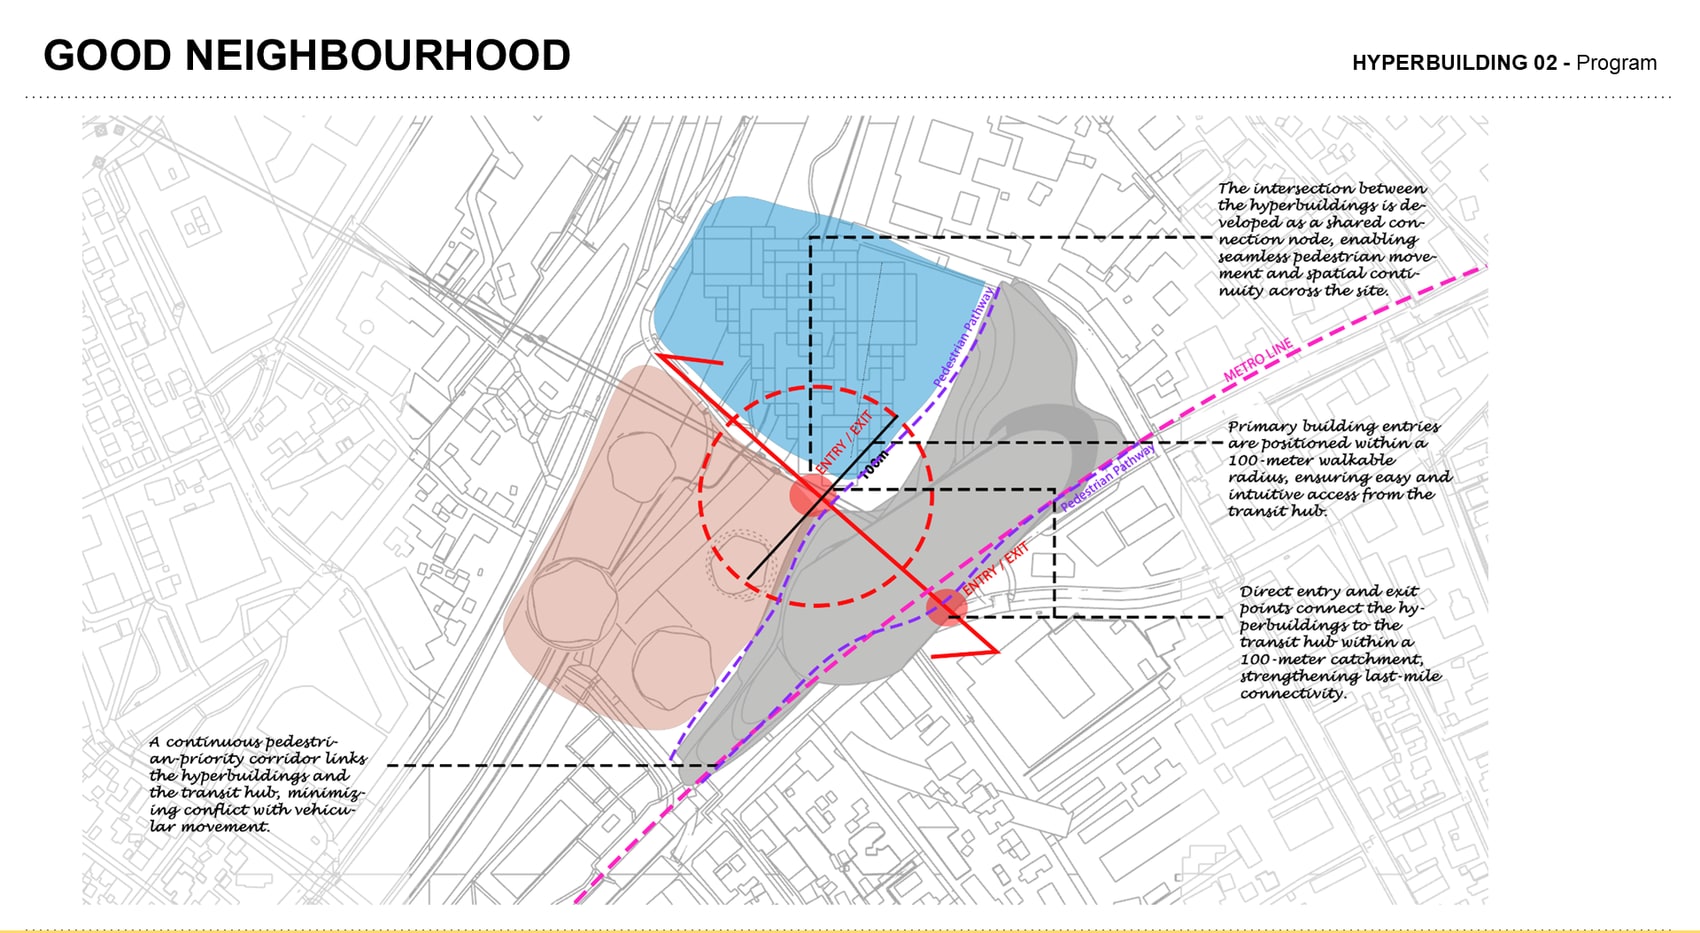
The Good Neighbour analysis fixes the hub into its surroundings: primary entries sit within a 100-metre walkable radius for intuitive access, direct entry/exit points connect the hyperbuildings to the hub within that catchment to strengthen last-mile connectivity, the intersection between hyperbuildings becomes a shared connection node for seamless pedestrian movement, and a continuous pedestrian-priority corridor links them while minimising conflict with vehicles.
One integrated megastructure
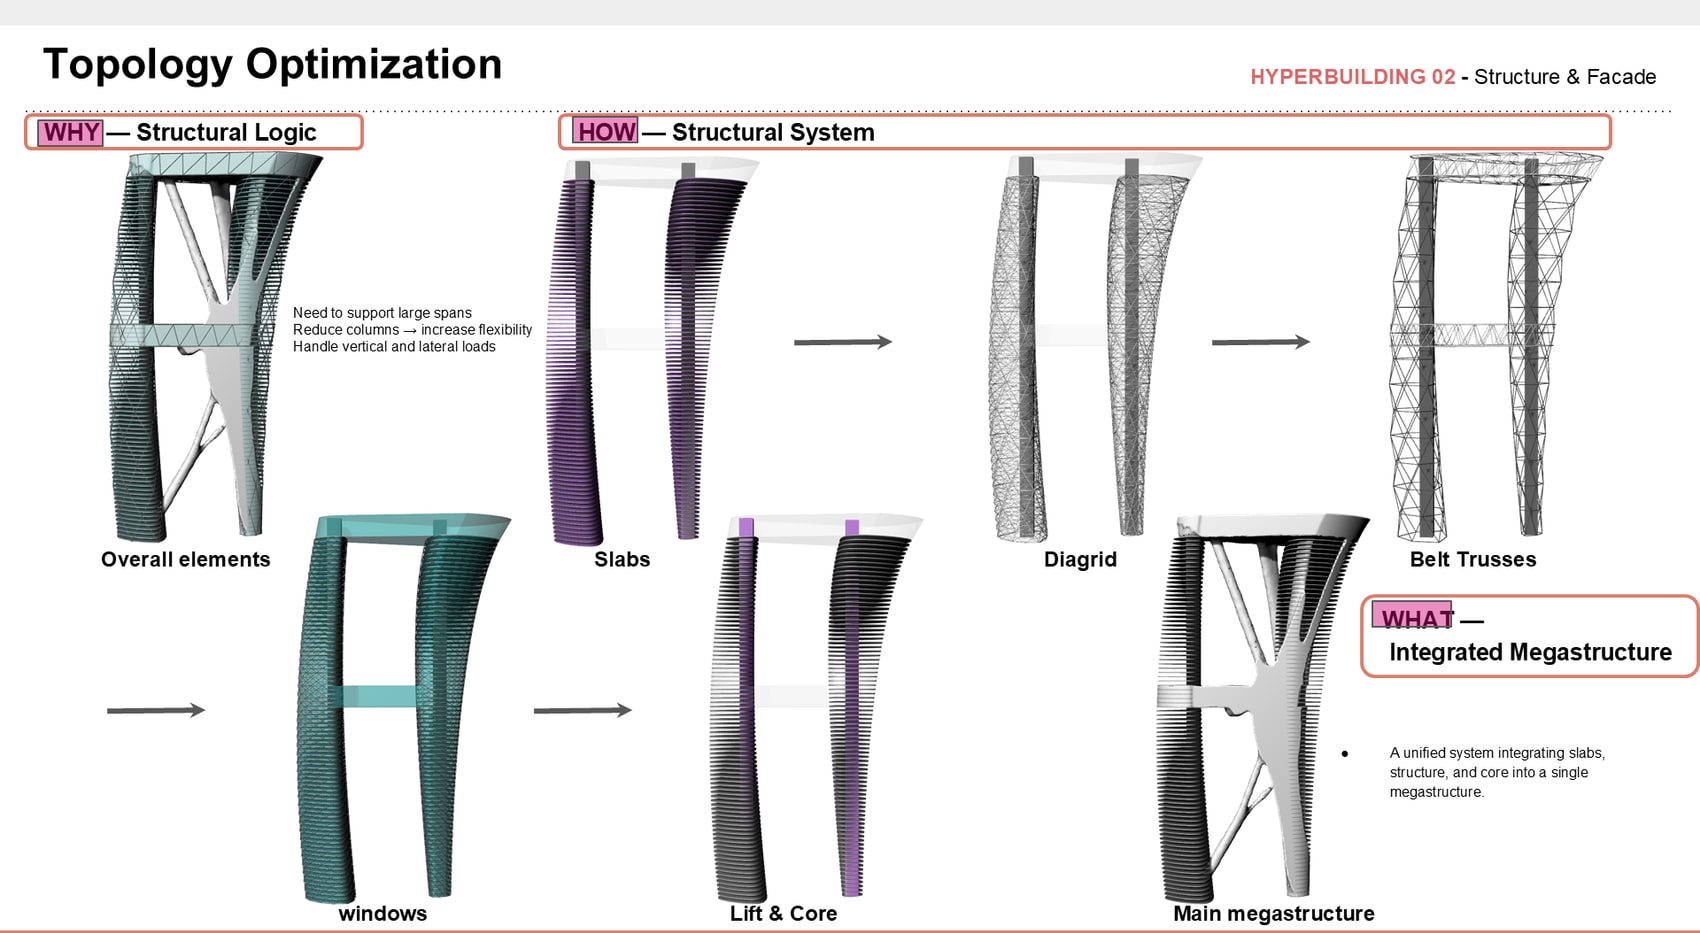
The Structure team translated our zoning into a unified megastructure. The why: support large spans, reduce columns to increase flexibility, handle vertical and lateral loads. The how: decompose the tower into slabs, diagrid, belt trusses, lift and core, then recombine them — with Ameba topology optimisation stripping material from the initial design domain and co-evolving the form. The what: a single system integrating slabs, structure and core, with 16×16 m concrete cores spaced 40–60 m for egress and four slab typologies from light (offices) to heavy (infrastructure).
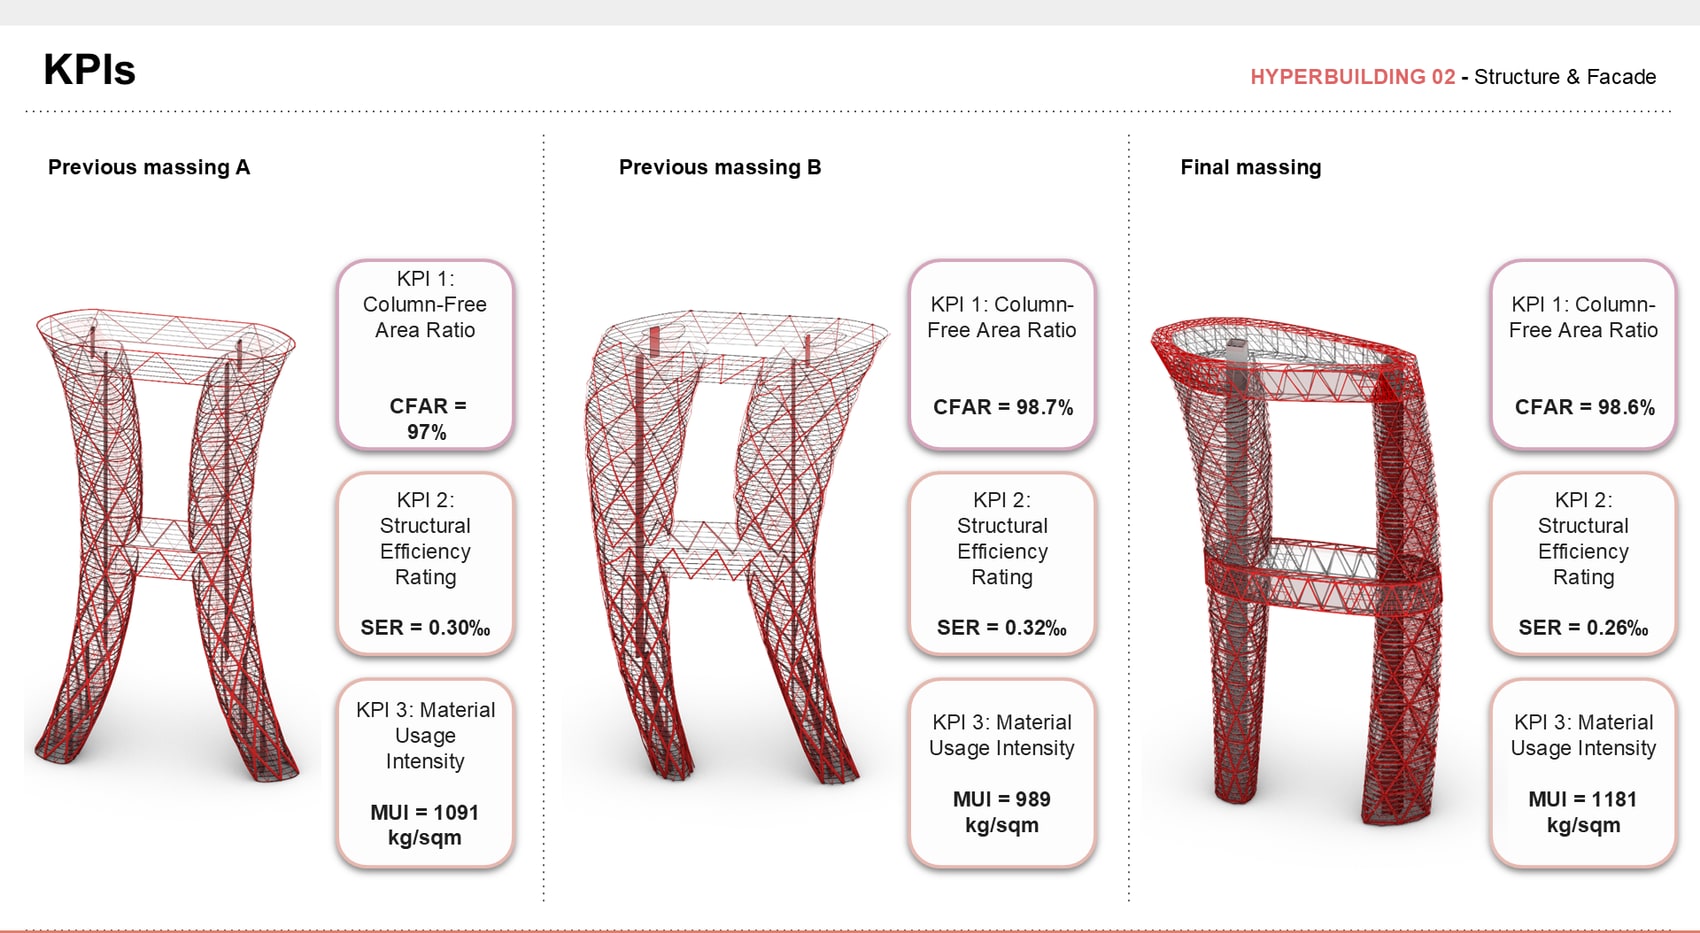
Three massings were measured against each other. Previous massing A scored 97% CFAR at 1,091 kg/m²; massing B pushed to 98.7% CFAR at 989 kg/m²; the final massing settles at 98.6% CFAR, SER 0.26‰ and 1,181 kg/m² MUI — trading a little material intensity for the resolved form.
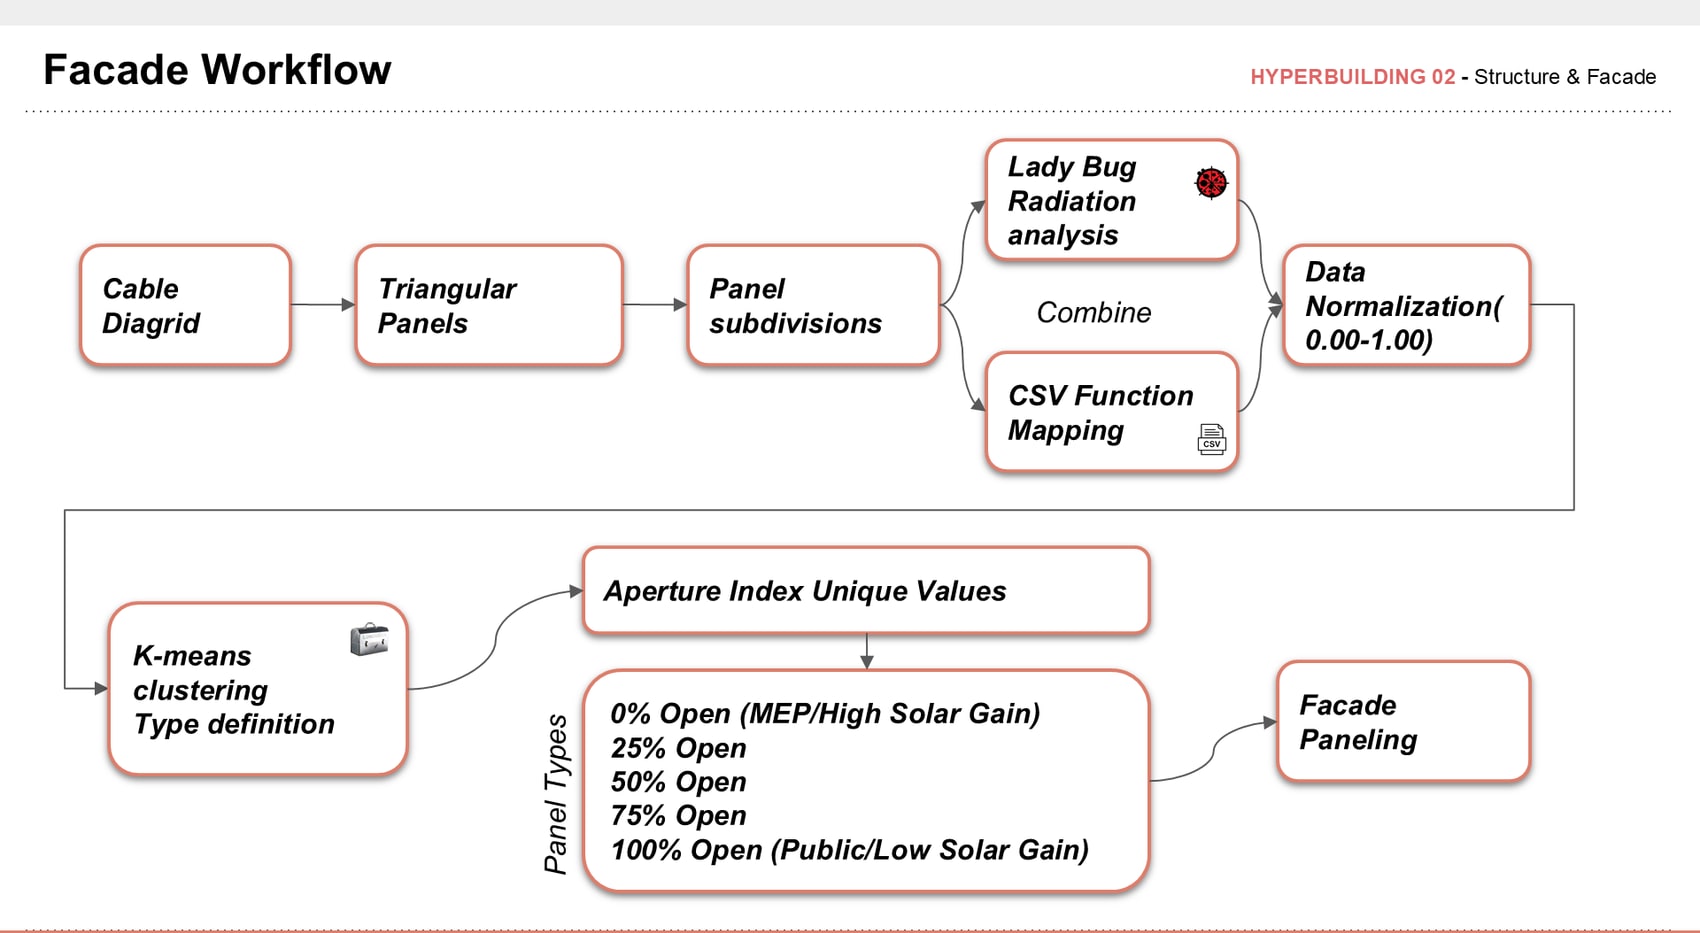
The facade follows the cable diagrid into triangular panels and subdivisions, combines Ladybug radiation analysis with CSV function mapping, normalises the result 0.00–1.00, then runs K-means clustering to define an aperture index — five panel types from 0% open (MEP, high solar gain) to 100% open (public, low solar gain).
The live protocol
The Data team established demand and performance criteria and kept the whole system in sync. Four KPI families — CFAR (spatial), MUI (performance), ERP (operational) and Modularity Index (structural) — were benchmarked against built references, then wired into a live six-step protocol: Rhino → Grasshopper → Speckle + Python → dashboard → web platform → feedback, with rules and metadata circulating back into the model and results dropping out as CSAR/MUI/EUI spreadsheets. Move a column and the dashboard updates automatically — no downtime, no file requests, no rework.