Graph Machine Learning
Reading buildings as networks — every room a node, every door an edge — to learn room types, expose circulation, and reveal how space is really connected.
- Node classification with GraphSAGE — 45% → 85.5% with geometric features
- Centrality, shortest-path, visibility & community detection across three buildings
- Topological + IFC spatial-relationship modelling of real plans
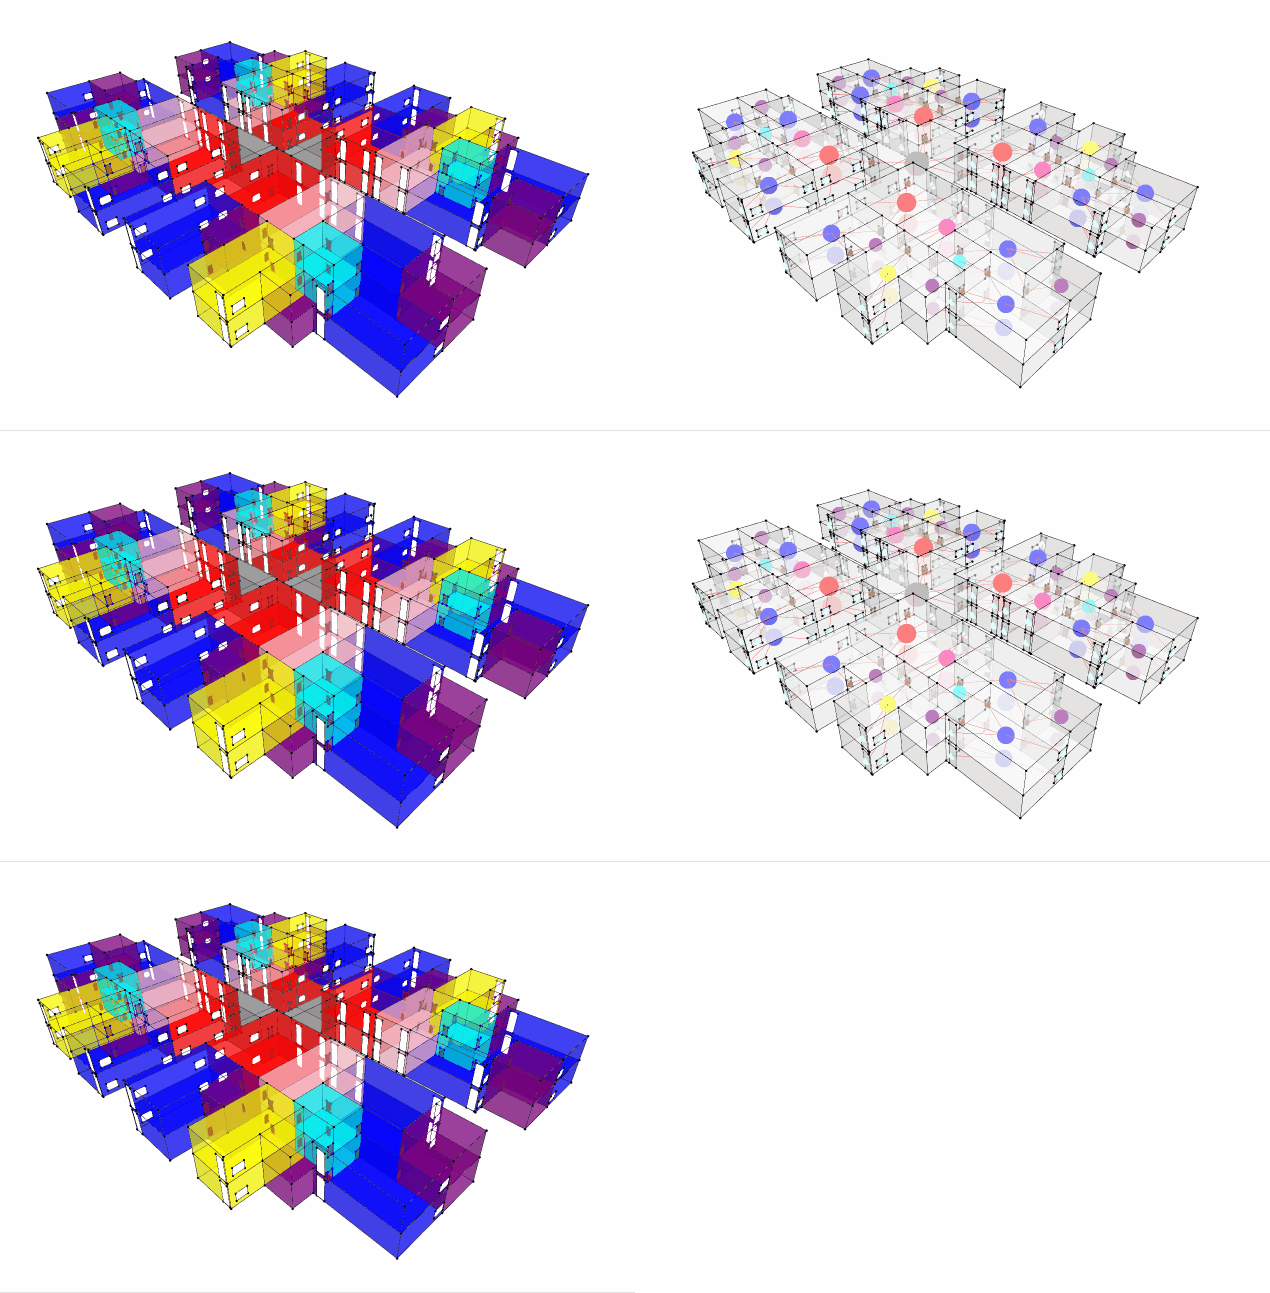
Apartment Complex Network Graph
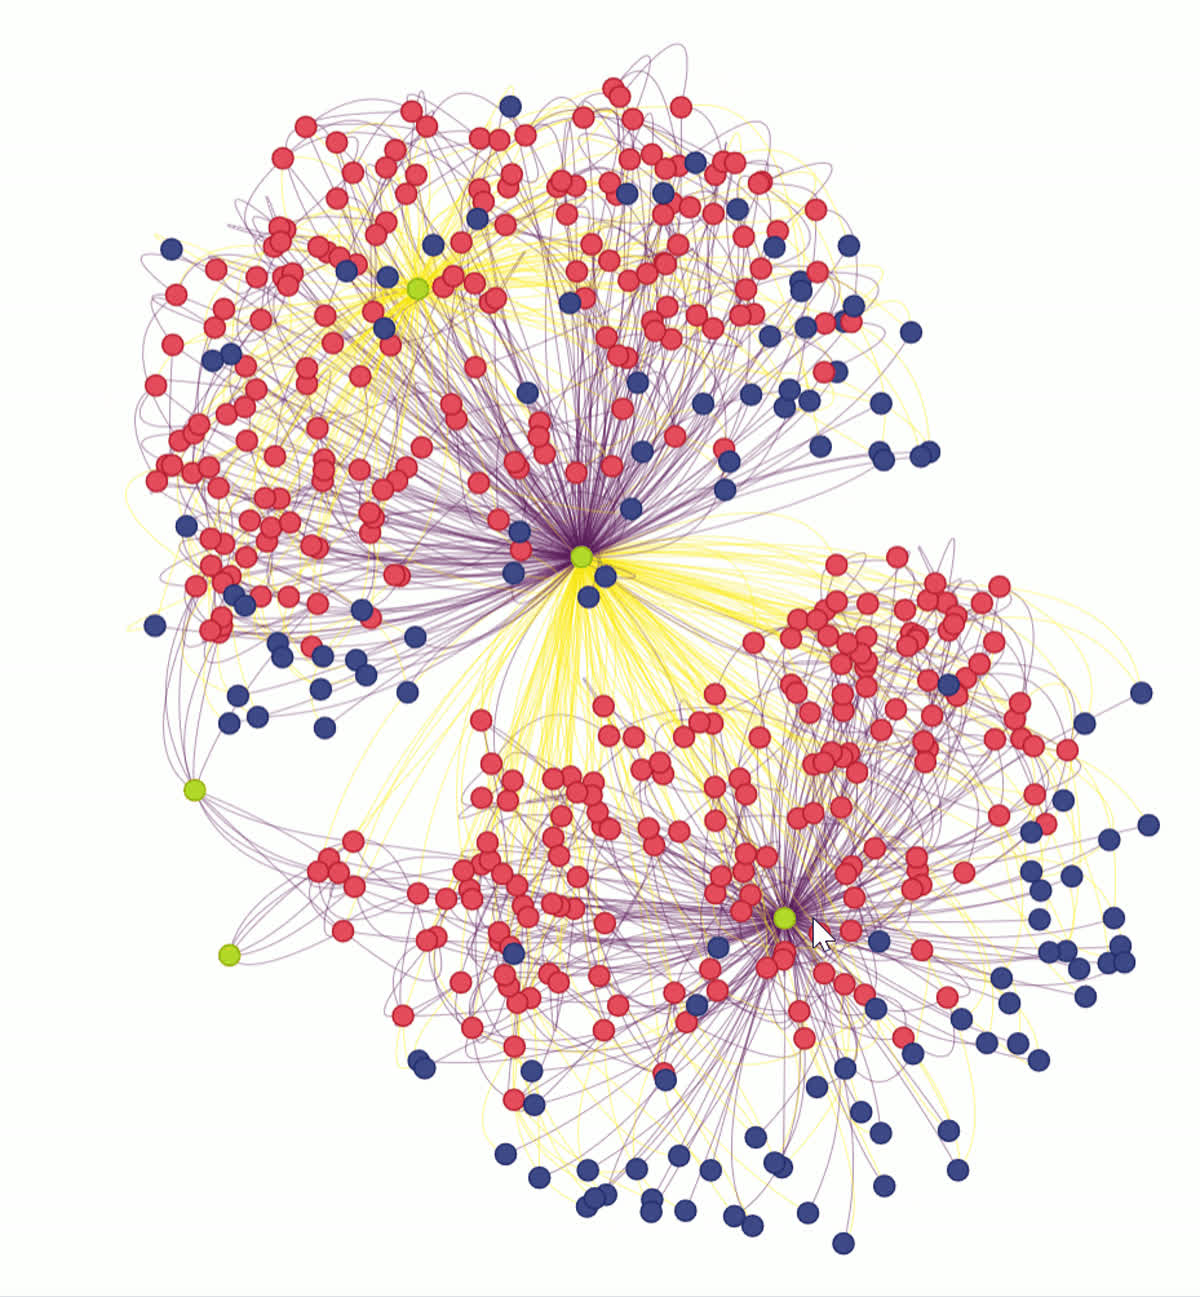
Topological modelling translates an apartment complex into a graph, revealing patterns of connectivity, accessibility and spatial hierarchy. Apartments, corridors, staircases and lobbies become nodes; doors and shared-access zones become edges. Central nodes emerge as shared circulation hubs while peripheral nodes read as private units — exposing the hierarchy of movement from public entry to private living space, and the balance between shared and private domains.
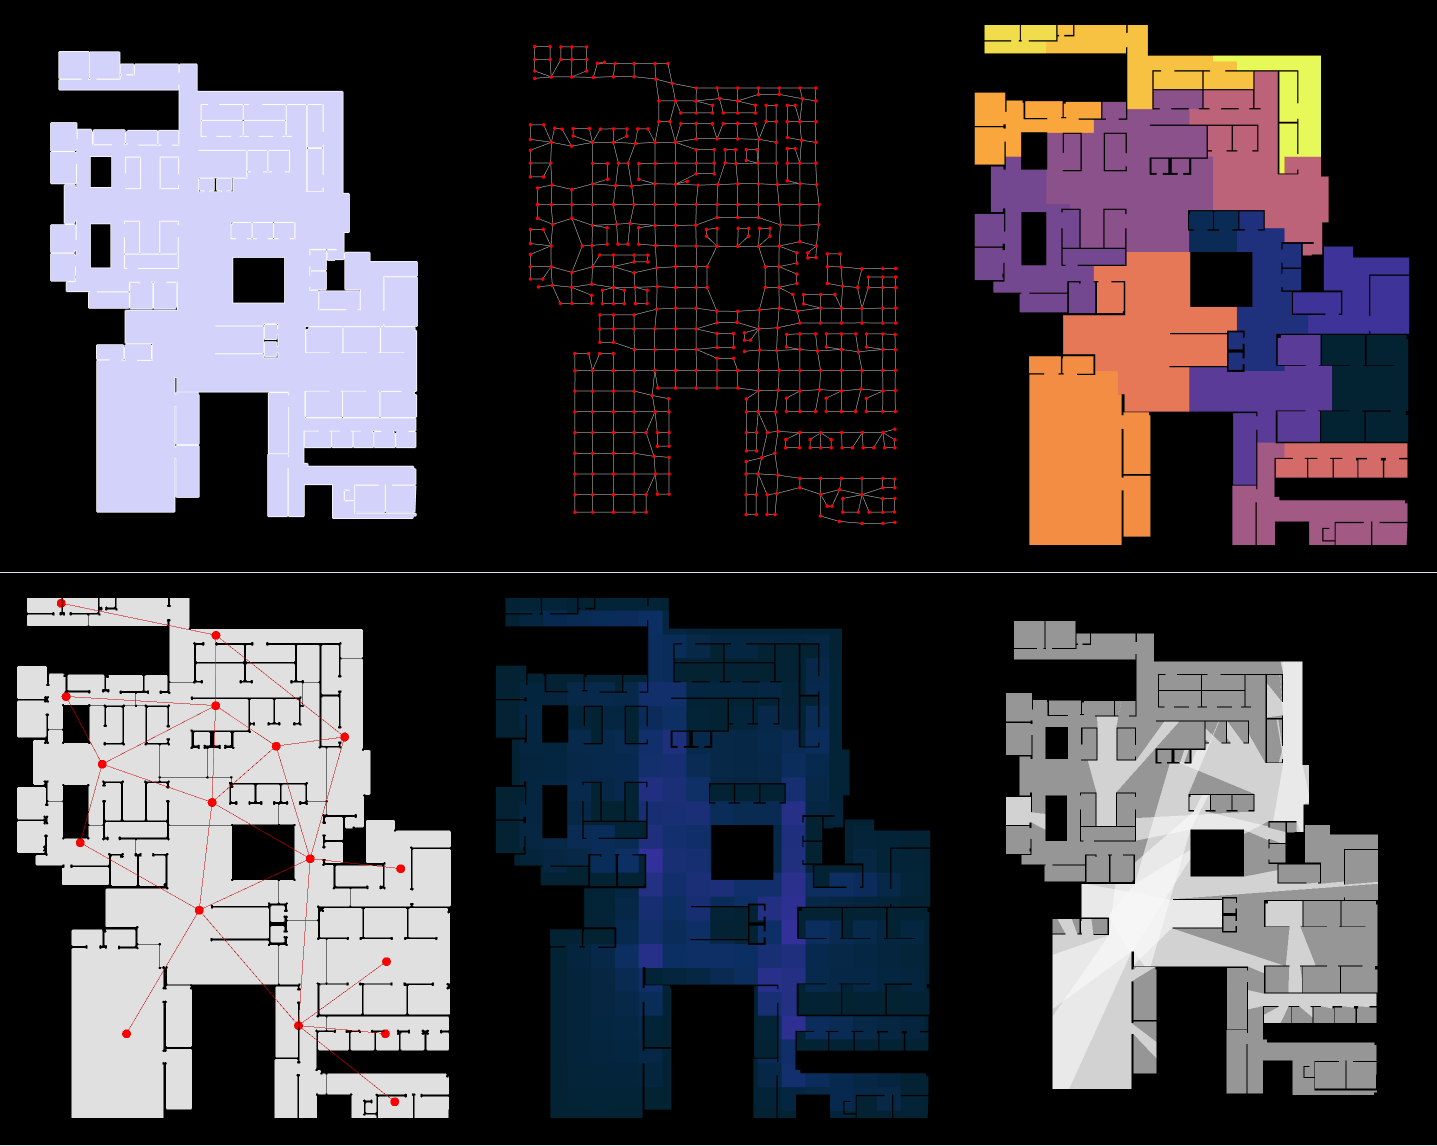
Shopping Market — Jayanagar, Bengaluru
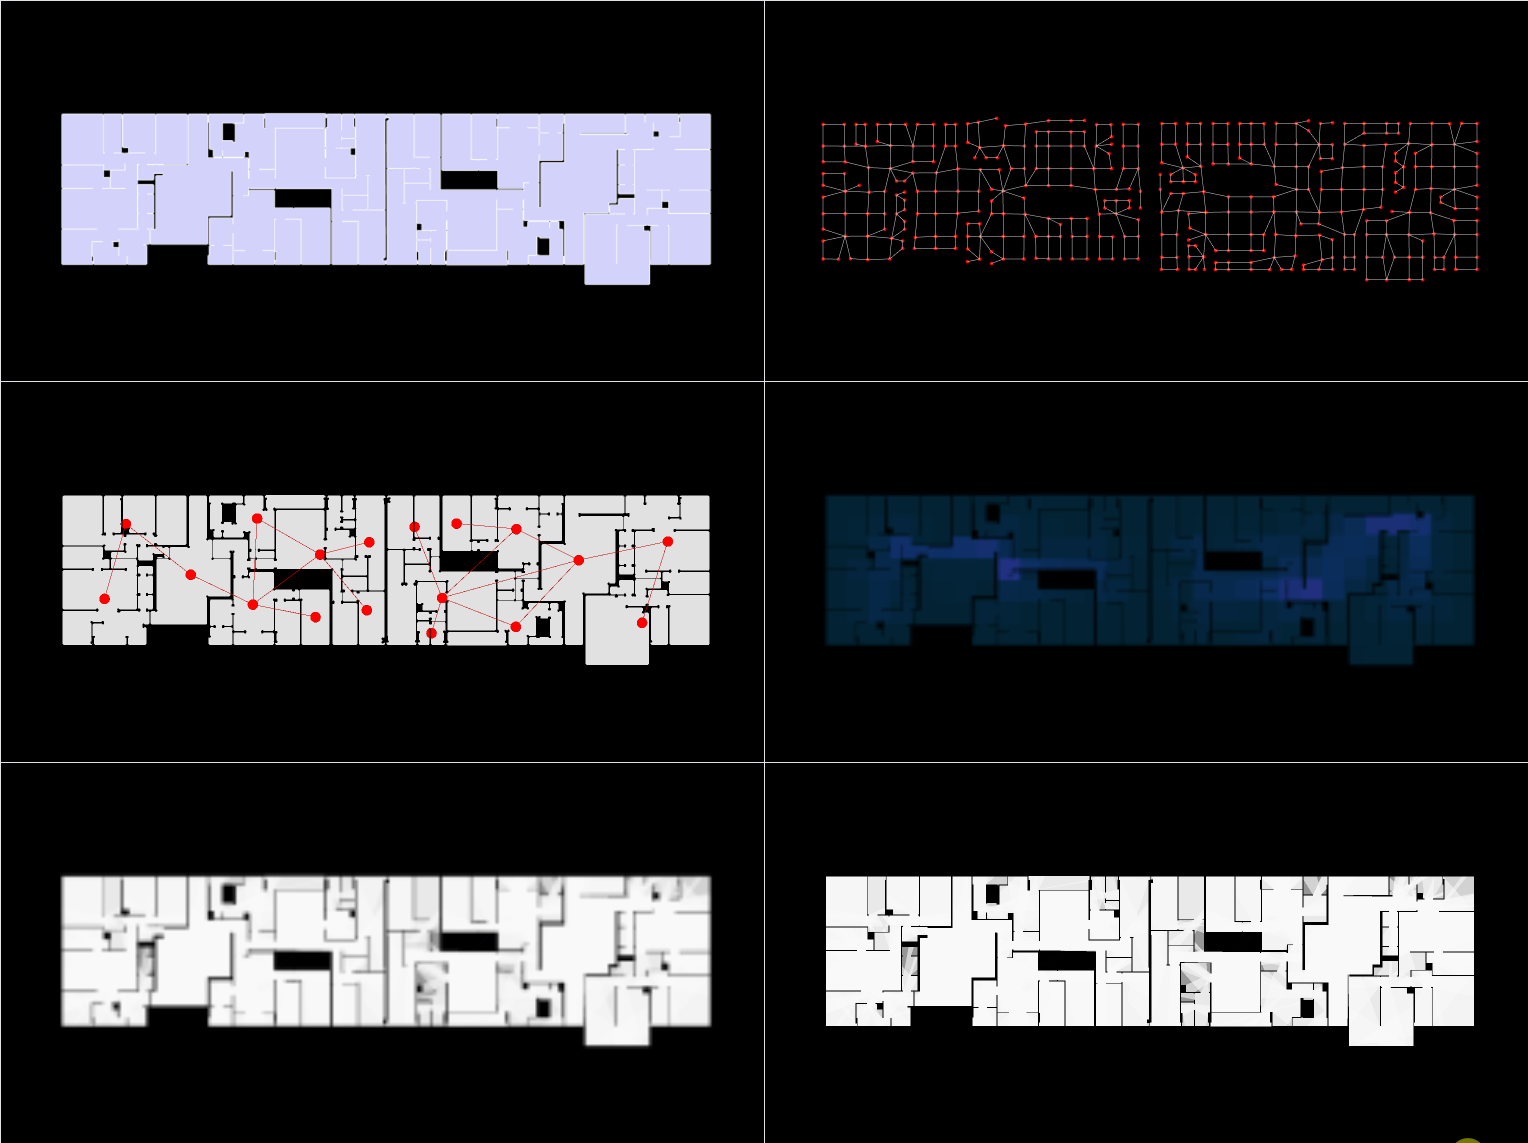
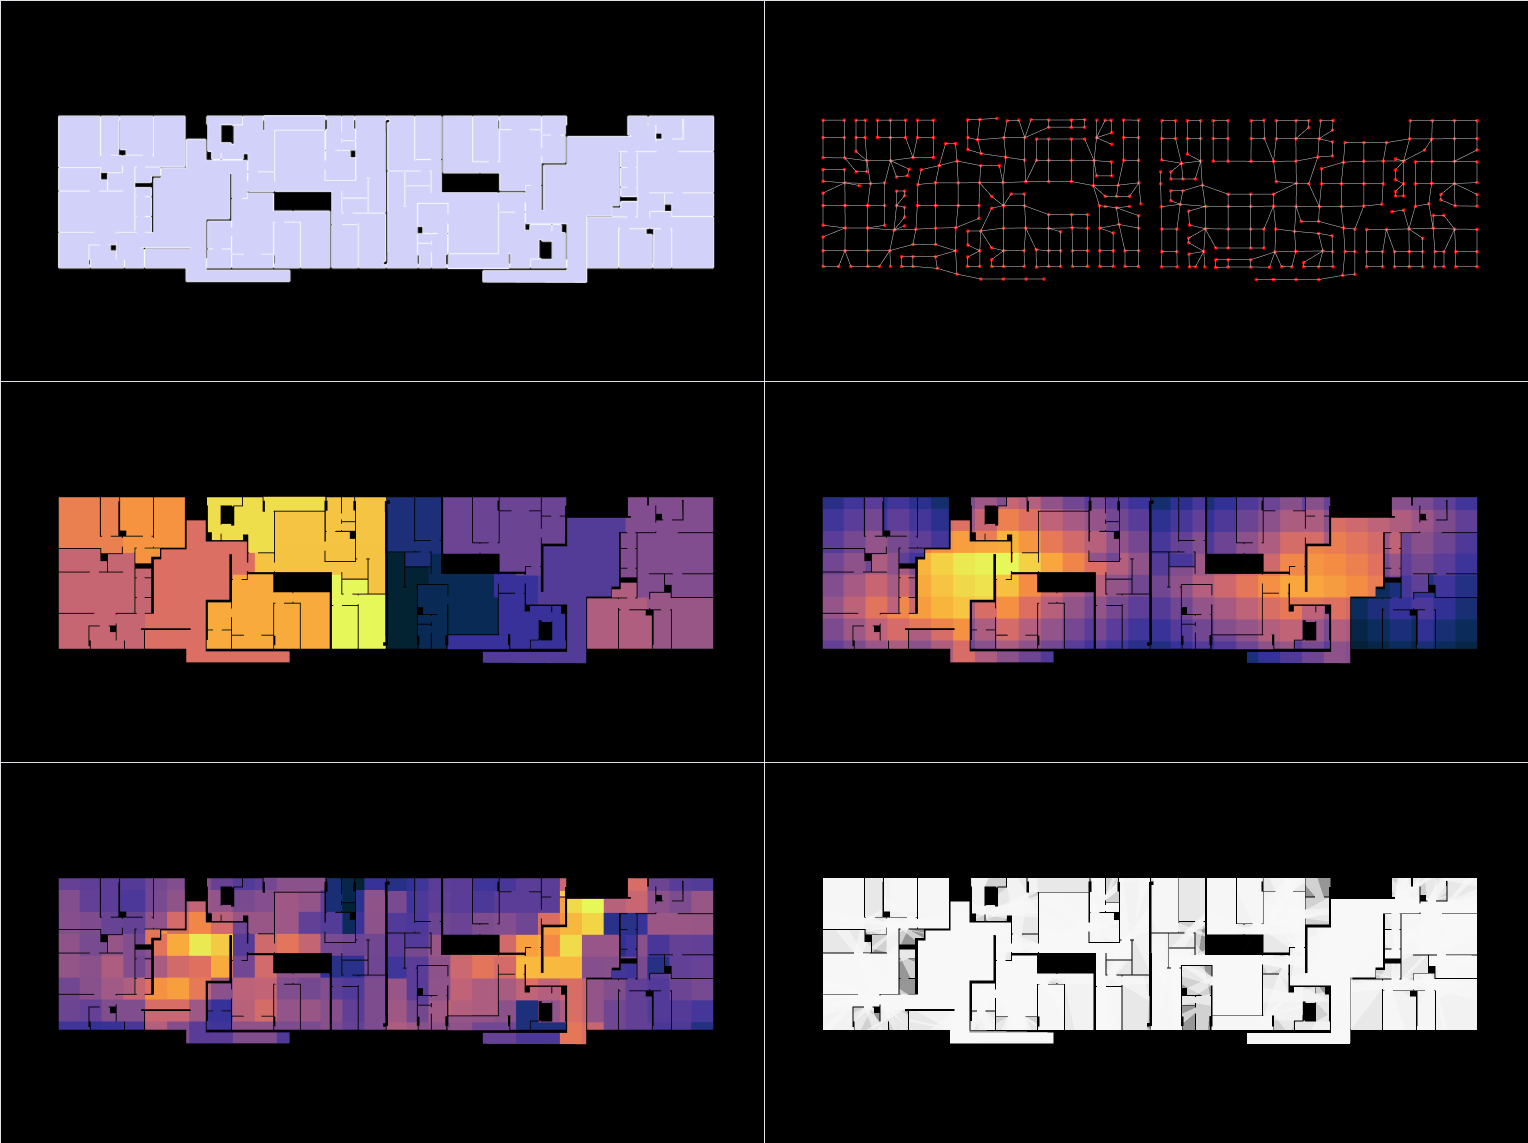
A full spatial analysis of a 14,624 m² market on a 6 m visibility grid (511 spaces). Closeness and betweenness centrality identify the central circulation spine as the most integrated, accessible zone — with 92 high-flow bottleneck connectors — while community detection compares the network's auto-detected clusters against the expected zoning. Visibility-graph and IFC spatial-relationship analyses confirm a highly centralized structure where a few dominant hubs distribute movement across the whole building.
The Interlace — Room-Type Prediction
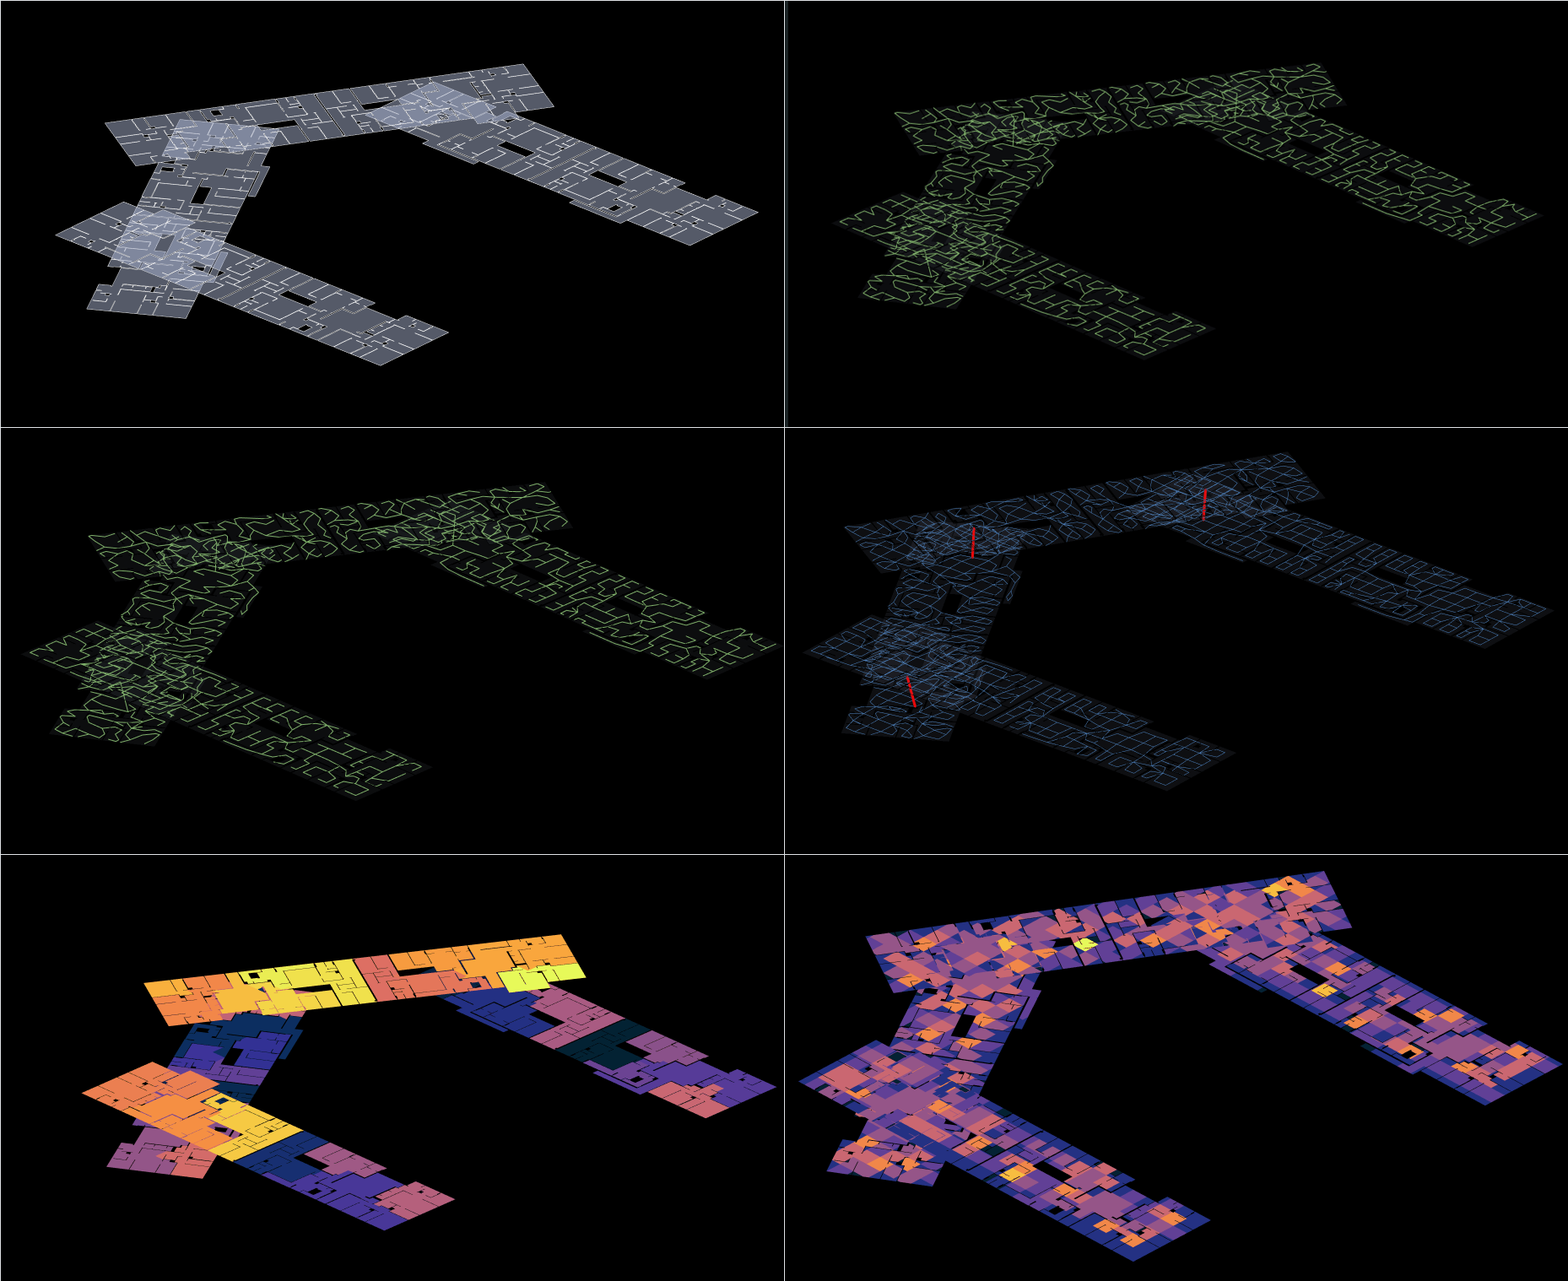
Built on OMA's The Interlace in Singapore, this pipeline makes a building's spatial structure explicit, analysable and learnable — floor plans become graphs where every room is a node and every door an edge. A pre-trained model reached 45% on unseen rooms (~4× random); retraining with richer geometric features — area, shape, connectivity — lifted node classification to 85.5% held-out accuracy, classifying 418 rooms into 9 types across a 3D cross-floor graph of 1,355 cells.